
Bitcoin Tests Key Support Rally Toward $101.5K?
Bitcoin tests key support as bulls reset for a futures-led push toward $101.5K. Key levels, momentum signals, and market catalysts explained.
Whenever Bitcoin tests key support, the market goes quiet for a moment—then the real story begins. Price may look like it’s simply pausing, but underneath, liquidity is shifting, leveraged positions are adjusting, and traders are positioning for the next directional move. This stage is often where the strongest rallies are born, especially when bulls reset after a sharp run or a choppy consolidation.
A support test is not just about “whether Bitcoin holds.” It’s about what kind of participants are defending that level and how they’re doing it. Spot buyers tend to move slowly, gradually absorbing sell pressure. Futures traders move fast, reacting to momentum, funding rates, and liquidation thresholds. When a market starts transitioning from spot-driven demand into a futures-led rally, it can accelerate quickly—sometimes faster than people expect.
That’s why this moment is attracting attention: Bitcoin tests key support while the market structure still looks bullish on higher timeframes. If buyers manage to defend this level, it can act like a spring compressing. A controlled dip, followed by a reset in leverage, creates the conditions for a sharp push higher. In that context, the target of $101.5K becomes more than just a headline—it becomes a logical extension of price structure, liquidity zones, and trader psychology.
In this article, we’ll break down what support tests really mean, why bulls reset matters, how futures can power the next leg, and what signals could validate a move toward $101.5K. You’ll also learn how to recognize invalidation levels, identify healthy consolidation, and avoid common traps that shake out traders before the real rally begins.
Bitcoin tests key support: What “key support” actually means
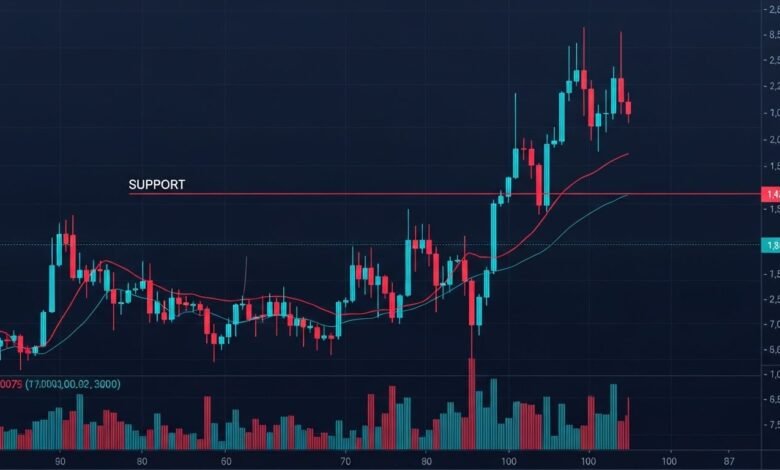
When traders say Bitcoin tests key support, they’re describing a price zone where buyers have previously stepped in with enough force to stop a decline. This isn’t just a single line on a chart. Support is usually a region—an area where demand historically exceeded supply.
A key support becomes more important when multiple factors converge in the same zone. For example, price might be landing near a previous breakout level, a high-volume node on a volume profile, and a major moving average at the same time. That confluence often attracts both technical traders and algorithmic strategies.
Support also matters because it defines risk. Bulls can place stop-losses just below it, while bears can attempt breakdown trades below it. That’s why these areas become battlegrounds: they concentrate orders, liquidity, and emotion.
Most importantly, a support test is not automatically bullish. Bitcoin tests key support can also be a warning if demand is weak, if bounces are shallow, or if volume declines in a way that signals exhaustion. The difference between a healthy retest and a structural breakdown is often visible in how price reacts after the first bounce: does it reclaim levels quickly, or does it churn and grind lower?
Why bulls reset before major rallies
A rally doesn’t move higher forever without breathing. Even in strong uptrends, leverage builds up in the system as traders chase momentum. Over time, that leverage becomes fragile. When too many participants are positioned the same way, price becomes vulnerable to a flush—often triggered by a small dip that cascades into liquidations.
That’s where the phrase “bulls reset” becomes important. A reset is essentially a market clearing event that reduces crowded positioning. It can happen through a quick liquidation wick, a multi-day sideways chop, or a moderate pullback that cools down indicators.
A proper reset usually includes several features:
Price revisits a logical support zone rather than collapsing randomly.
Open interest either declines or stabilizes instead of expanding aggressively into weakness.
Funding rates normalize after being overheated.
Spot demand begins to return while leverage becomes more cautious.
When Bitcoin tests key support during a reset phase, it can actually be bullish—because it’s showing that the market is digesting gains rather than flipping into a bear trend. In this setup, bulls aren’t disappearing; they’re reorganizing. They’re reducing risk, waiting for confirmation, and preparing for the next wave of demand.
Futures-led rally dynamics: How leverage accelerates Bitcoin moves
A futures-led rally is different from a slow spot-driven uptrend. Spot-led moves tend to be steadier: buyers purchase actual BTC, and price climbs as supply gets absorbed. Futures-led moves can be explosive because leverage acts like a multiplier. As price rises, short positions get squeezed, liquidations force buying, and momentum traders pile in.
This kind of rally often follows a reset because the market becomes “lighter.” Once liquidation pressure has cleared and over-leveraged longs are flushed out, there’s room for new positions to enter at better prices. When that happens, futures markets can drive a strong impulse move.
Several ingredients frequently show up before a futures-driven breakout:
- A stable or rising spot premium, suggesting real demand.
- Funding rates close to neutral, showing leverage is not overcrowded.
- A slow rebuild in open interest during consolidation rather than during panic.
- Liquidity clusters above resistance zones, attracting price like a magnet.
In other words, when Bitcoin tests key support and holds, futures traders look for confirmation that downside risk is limited. Once they sense stability, they re-enter aggressively. If the level holds and price pushes above nearby resistance, that’s often when the futures engine ignites.
Path to $101.5K: Why this level matters psychologically and technically
The target $101.5K is notable for two main reasons: psychology and structure.
Psychologically, round numbers like $100K carry huge emotional weight. Traders, investors, and even mainstream media treat them as milestones. Because of that, price tends to react strongly around them. Above $100K, markets often experience a burst of optimism and increased participation, but also heavy profit-taking and volatility.
Technically, $101.5K can act as a logical “expansion” target if Bitcoin breaks out from a consolidation range. Markets often move in waves. After a breakout, price tends to seek the next major liquidity pocket—where stop orders, take-profit orders, and fresh breakout buys accumulate. That area can land above the big round number, because traders often place orders slightly beyond it.
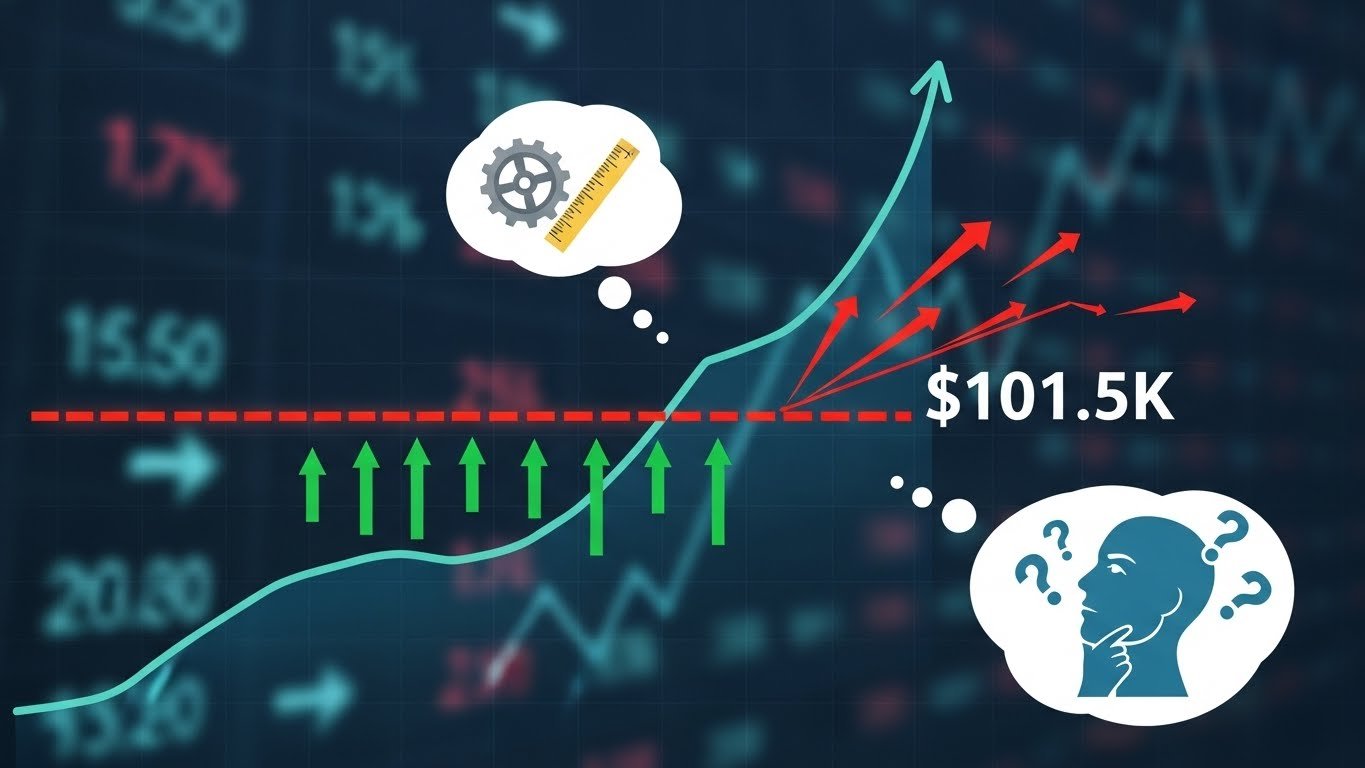
If Bitcoin tests key support and then breaks higher, the move toward $101.5K becomes plausible as a momentum continuation target, especially if resistance zones above are relatively thin and futures liquidity builds overhead.
That said, targets like $101.5K should be treated as zones, not guarantees. Price can overshoot, front-run, or reject hard—depending on market conditions, macro news, and derivatives positioning.
Key signals to watch as Bitcoin tests key support
When Bitcoin tests key support, the market usually offers clues about whether the level is holding for continuation or weakening toward a breakdown. The most important signals are not always the flashiest indicators—they’re the ones tied to participation, liquidity, and structure.
Volume behavior and the quality of the bounce
A healthy support defense often shows strong buying volume on the bounce, or at least reduced sell volume on the dip. If the bounce is weak and volume dries up, it suggests that buyers are hesitant. If volume spikes on the drop but fades on the rebound, the market may be distributing rather than accumulating.
However, in some bullish resets, volume may remain moderate. That doesn’t automatically mean weakness. Sometimes markets reset quietly before expanding. The real clue is whether sellers can push price significantly below support and keep it there. If not, the support is doing its job.
Market structure and higher timeframe trend
If Bitcoin is still making higher highs and higher lows on the daily or weekly timeframe, then a support retest can be viewed as a potential continuation setup. If the structure has flipped and the market is making lower highs, then the same support test becomes riskier.
A key concept here is whether the support zone is a former resistance. When old resistance becomes new support, it often reinforces bullish structure. That’s why traders pay attention to retests after breakouts—especially when Bitcoin tests key support near a prior range top.
Derivatives positioning: funding and open interest
Derivatives data can tell you whether a rally is likely to be smooth or violent. If funding rates are extremely positive, it means too many traders are long and paying a premium. That can set up a long squeeze. If funding is neutral or slightly positive while price holds support, the market may be healthier.
Similarly, open interest rising during a support breakdown can be bearish because it suggests new shorts are entering aggressively—or trapped longs are doubling down. But open interest stabilizing or declining while price holds support may signal a reset is working, increasing the odds of a futures-led rally later.
Scenarios: What happens next from this support test
Because Bitcoin tests key support in a zone that could define the next trend leg, it helps to think in scenarios rather than predictions. Bitcoin often moves in ways that punish certainty.
Support holds and a futures-led rally begins
If Bitcoin defends support, reclaims a nearby resistance level, and begins printing higher lows, bulls will likely increase exposure. In this case, the reset is complete: over-leveraged positions have been cleared, momentum stabilizes, and futures traders can drive expansion.
In this scenario, short sellers may get trapped if they enter late on the breakdown attempt. As price moves higher, the short squeeze fuels acceleration. That is often how price starts running toward targets like $101.5K, especially if liquidity above remains thick.
Support holds but price consolidates longer
Not every support defense leads to an immediate surge. Sometimes the market chooses a slow grind, building a base while volatility compresses. This is common when macro uncertainty is high or when traders are waiting for a catalyst such as inflation data, central bank commentary, or ETF flow shifts.
In this outcome, the bullish bias remains, but patience is required. The longer Bitcoin holds the support zone without breaking down, the more confidence bulls gain. Eventually, the compression can create a powerful breakout, and the move can still transition into a futures-led rally.
Scenario 3: Support breaks and the market searches for deeper liquidity
If Bitcoin fails to hold key support decisively, the next move is often a hunt for liquidity below. That doesn’t necessarily mean the bull market is over, but it does change the timeframe and risk structure.
Breakdowns can trigger cascading liquidations, and price may drop faster than expected. However, those flushes can also create strong dip-buying opportunities—especially if on-chain or spot demand remains robust. A breakdown becomes more concerning if it flips major higher timeframe structure and turns previous supports into resistance.
Risk management and trader psychology during support tests
Support tests are where emotions spike. Bulls fear a breakdown. Bears feel confident that the trend is flipping. Meanwhile, large players often use this environment to accumulate liquidity.
If you’re trading this environment, the key is avoiding reactive decisions. When Bitcoin tests key support, price frequently wicks below support briefly, triggers stop-losses, then reclaims the level. This is known as a liquidity sweep. If you treat every wick as a breakdown, you’ll get chopped.
A more stable approach is to watch for confirmations. For example, if price reclaims the level and closes above it on the timeframe you trade, that is more meaningful than a brief dip. Similarly, if price breaks down and fails to reclaim support on retests, that is more meaningful than a single red candle.
For long-term investors, the bigger question is whether the broader thesis remains intact. If so, support tests can be viewed as normal volatility within an uptrend, especially when bulls reset and remove excessive leverage from the system.
Conclusion
Right now, Bitcoin tests key support at a moment when market structure still offers bulls a credible path forward. Rather than signaling weakness, this support retest may be a classic reset—an environment where leverage is cleared, buyers regain control, and conditions become ripe for a futures-led rally.
If support holds and Bitcoin reclaims nearby resistance with improving momentum, the market could transition quickly from consolidation to expansion. In that case, the psychological barrier near $100K becomes the next magnet, and the target of $101.5K emerges as a reasonable continuation zone.
Still, support tests are decision points. Traders and investors should respect invalidation levels and avoid emotional reactions to short-term wicks. Whether the next move is immediate or delayed, this phase is shaping the next major trend leg—and the way Bitcoin behaves here will likely determine how fast it can run when bulls fully reset and the futures engine turns back on.
FAQs
Q: What does it mean when Bitcoin tests key support?
When Bitcoin tests key support, price is revisiting an important demand zone where buyers previously stepped in. It’s a critical area that can confirm trend continuation if it holds or signal weakness if it breaks.
Q: Why do bulls reset before a rally?
A bulls reset happens when excess leverage is cleared through a pullback or consolidation. This reduces the chance of a long squeeze and creates healthier conditions for a new upward move.
Q: What is a futures-led rally in Bitcoin?
A futures-led rally is driven by leveraged trading activity in derivatives markets. It can accelerate quickly because short squeezes and liquidations force additional buying as price rises.
Q: Is $101.5K a realistic Bitcoin target?
$101.5K can be realistic if Bitcoin holds support, breaks above resistance, and liquidity above attracts price. However, it’s best viewed as a target zone, not a guarantee.
Q: How can I avoid getting trapped during a support test?
Avoid reacting to single wicks. Wait for confirmation such as reclaiming support on candle closes, stable derivatives metrics, and improving market structure. During periods when Bitcoin tests key support, patience often outperforms impulsive entries.
See More: Bitcoin Near $90K as Volume Shrinks Altcoins Split