Gold & Bitcoin Weekly Outlook DXY, FX, Oil Ahead
Weekly technical outlook for Gold, Bitcoin, DXY, EUR/USD, AUD/USD, and Oil with trend signals, key levels, and clearer market scenarios.

Weekly technical outlook should feel like a map, not a maze. You should be able to read it quickly, understand the trend, spot the important zones, and know what would change your mind. That’s what this Gold, Bitcoin, DXY, EUR/USD, AUD/USD, and Oil weekly technical outlook aims to do.
These six markets connect in ways traders often feel but don’t always organize. When the US dollar strengthens, it can reshape the tone across foreign exchange and commodities. When oil prices jump, inflation expectations can rise, which can influence yields, currencies, and risk appetite. When Bitcoin turns volatile, it can reflect shifts in liquidity and broader sentiment. Gold can behave like a safety asset in one moment and a yield-sensitive asset in the next. A clear weekly technical outlook helps you separate noise from structure.
This article focuses on the parts of technical analysis that consistently matter on weekly charts: trend direction, major swing areas, and confirmation signals. You’ll see frequent references to support and resistance, weekly closes, and momentum tools such as RSI and MACD. These tools don’t predict the future. They help you measure what price is doing now, and whether a move is likely to extend or stall. By the end, you’ll have a practical, readable weekly technical outlook for each market, plus a simple way to connect them into one cross-asset view.
How to Use This Weekly Technical Outlook
Before diving into each chart, it helps to define how weekly analysis should guide decisions. Weekly levels tend to matter more than intraday levels because more participants see them and react to them. Weekly candles also reduce false signals caused by headlines, session volatility, and short-term liquidity grabs.
A useful weekly technical outlook starts with three questions. Is the market trending or ranging? Where are the key support and resistance zones? What would confirm the next move, and what would invalidate it? If you always return to those three questions, your analysis stays calm, and your decisions stay consistent.
Gold Weekly Technical Outlook: Strength, Pullbacks, and Decision Zones
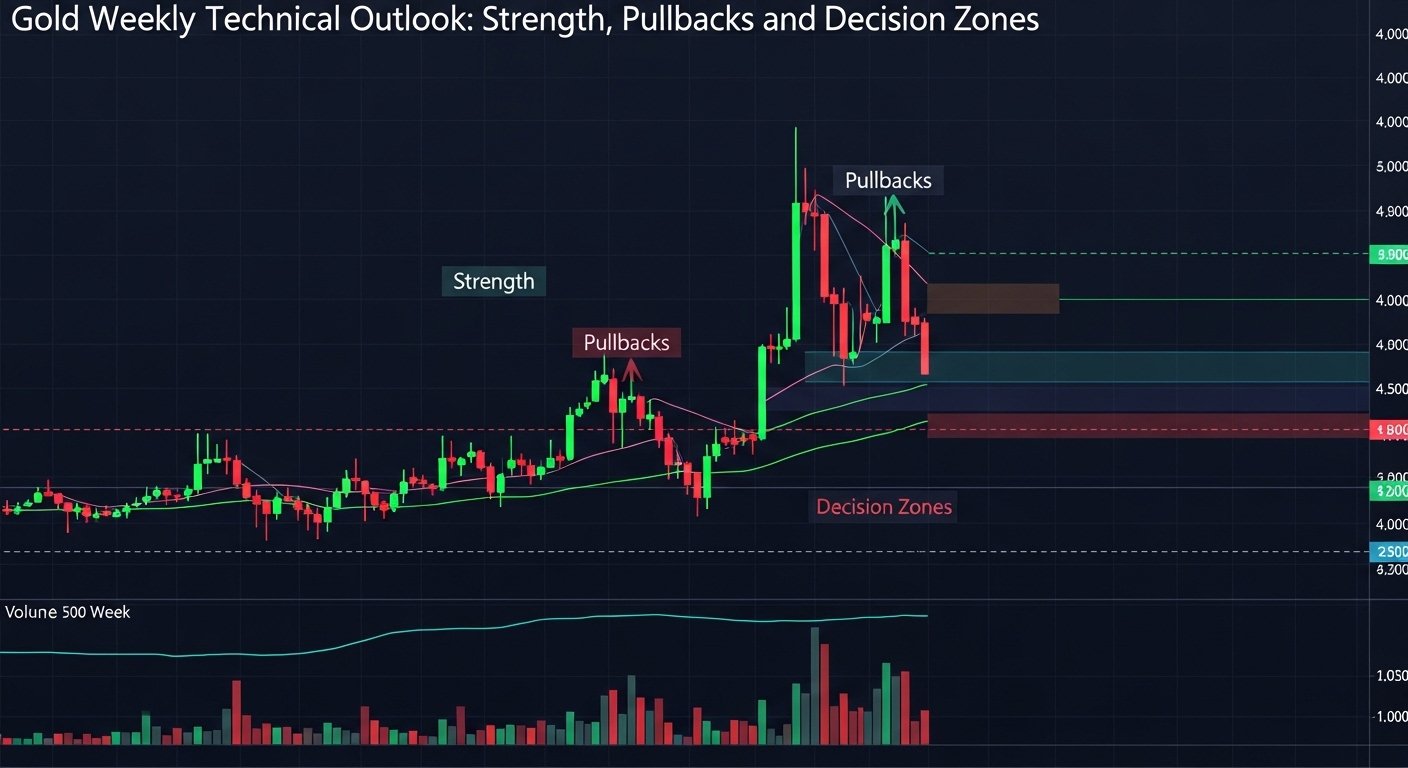
Gold is often one of the clearest weekly charts because it respects structure. In this weekly technical outlook, the key is to identify whether Gold is still building higher swing lows or starting to lose them.
Trend Perspective: When Gold Is Healthy vs. When It’s Weakening
A constructive Gold trend usually looks simple: price holds above prior breakout zones and doesn’t give back gains easily. On a weekly chart, that often means pullbacks are shallow and candles close firmly rather than collapsing into long selloffs. If Gold is above a rising moving average, it often signals that buyers still control the bigger picture.
Gold starts to look weaker when weekly candles begin closing below major swing lows. That doesn’t always mean a crash is coming, but it can mean the market is shifting into a deeper retracement phase. In a Gold weekly technical outlook, this is where patience matters. Instead of chasing, traders often wait for Gold to test support and show stability.
Momentum Signals: RSI and the “Energy” of the Trend
Momentum makes the structure more reliable. If weekly RSI holds above the midline and rises on rebounds, it often supports the bullish case. If price pushes higher but RSI refuses to follow, it can be a warning sign that the move is tiring. A readable weekly technical outlook treats momentum as a confirmation tool, not a standalone strategy.
Key Weekly Levels: Why the Close Matters More Than the Spike
Gold can spike above resistance and still fail if it cannot close strong. That’s why this weekly technical outlook emphasizes the weekly close. A strong close above resistance suggests acceptance. A rejection candle—especially one with a long upper wick—suggests selling pressure is active at that zone.
The best zones are usually the obvious ones: prior major swing highs, prior breakout points, and long-held consolidation ranges. When price returns to these areas, it tends to react. That reaction is what traders use to plan entries, exits, or patience.
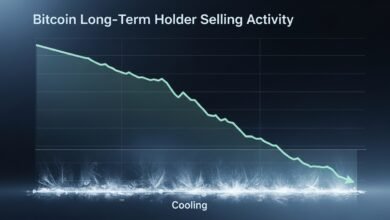
Bitcoin Weekly Technical Outlook: Volatility with Structure
Bitcoin can look chaotic on lower timeframes, but weekly charts often reveal clean structure. The goal of a Bitcoin weekly technical outlook is to identify whether Bitcoin is trending, coiling, or ranging.
Trend vs. Range: The Most Important Bitcoin Question
In trending phases, Bitcoin often moves in waves: impulse up, pullback, impulse up again. Pullbacks frequently respect previous resistance zones that become new support. That’s a classic bullish behavior and an important part of any Bitcoin weekly technical outlook.
In range phases, Bitcoin often tests the same ceiling and floor repeatedly. Many traders lose money in the middle of the range because the market feels active but provides no clear edge. A better approach is to focus on the range boundaries and wait for confirmation.
Breakouts and False Breaks: How Weekly Closes Filter Noise
Bitcoin is known for stop runs and liquidity sweeps. It can push above resistance, trigger breakout buyers, and then snap back into the range. That’s why a Bitcoin weekly technical outlook should treat a breakout as real only when the weekly candle closes beyond the level and follow-through appears. A strong close above resistance, followed by a retest that holds, often creates a cleaner continuation path. A close back inside the range often signals a trap and warns traders to stay defensive.
Momentum and Confirmation: RSI and MACD in Plain English
If weekly RSI is rising and MACD is supportive, breakouts often have more room. If RSI is flat and MACD loses strength, rallies can fade quickly. This isn’t about predicting. It’s about aligning your Bitcoin weekly technical outlook with the market’s current “push.”
DXY Weekly Technical Outlook: The Dollar as the Market’s Steering Wheel
DXY matters because it often shifts the tone across assets. A rising dollar can pressure EUR/USD and AUD/USD, and it can change how Gold and Oil behave. That’s why this weekly technical outlook treats DXY like a foundation.
Reading DXY Simply: Direction and Key Zones
A bullish DXY structure usually features higher lows and strong reactions from support. If DXY keeps bouncing from a well-defined base, the market is telling you the dollar has demand. If DXY breaks down through support and fails to reclaim it, the dollar tone may be weakening. In a DXY weekly technical outlook, the most useful zones are prior swing highs and prior swing lows. When DXY reaches those areas, it often pauses or reverses, and that pause can ripple into FX and commodities.
What DXY Can Signal for Gold and FX
If DXY pushes higher, EUR/USD can struggle, and Gold rallies may become more difficult. If DXY weakens, EUR/USD and AUD/USD often gain breathing room, and Gold can find support more easily. This isn’t a perfect rule, but it’s a useful cross-market clue inside a broader weekly technical outlook.
EUR/USD Weekly Technical Outlook: Clean Structure, Clear Decisions
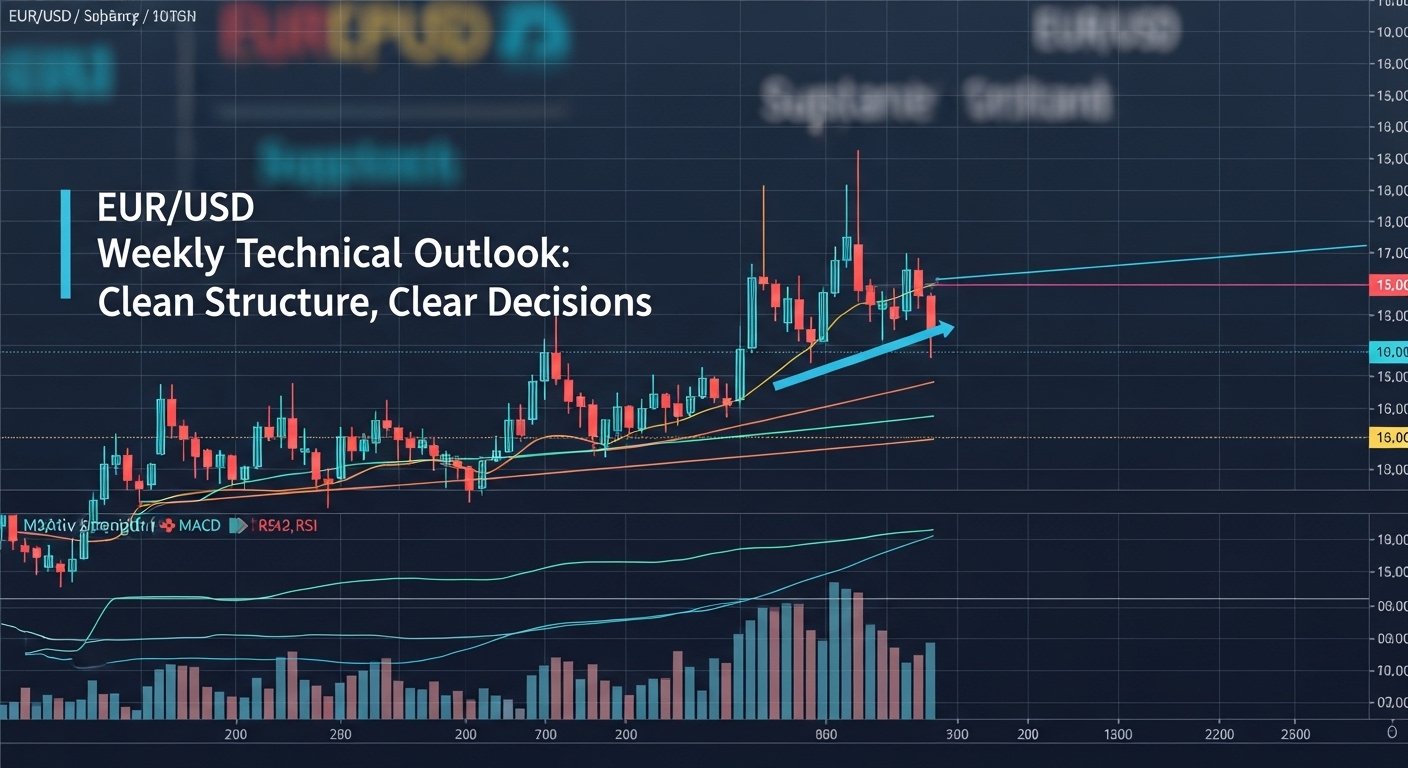
EUR/USD often respects weekly structure well, which makes it ideal for traders who like defined levels. A EUR/USD weekly technical outlook begins by identifying whether the pair is trending or boxed into a range.
Range Behavior: Why the Middle Is Usually a Trap
If EUR/USD has been rotating between a clear top and bottom, it’s usually better to avoid trades in the middle. The middle of the range often produces whipsaws because it’s not a true decision zone. A cleaner EUR/USD weekly technical outlook focuses on reactions at the boundaries. A bullish signal is when EUR/USD breaks above the range and holds that breakout on a weekly close. A bearish signal is when EUR/USD loses the range floor and cannot reclaim it.
Trend Behavior: Higher Lows vs. Lower Highs
When EUR/USD is trending higher, it tends to form higher lows and defend pullbacks. When it trends lower, it forms lower highs and fails at resistance. This sounds basic, but it’s powerful. A readable weekly technical outlook keeps the analysis grounded in what price is actually doing.
AUD/USD Weekly Technical Outlook: Risk Mood and Commodity Sensitivity
AUD/USD often behaves like a “risk thermometer.” When global growth expectations rise and the dollar weakens, AUD/USD can trend higher. When risk sentiment drops or the dollar strengthens, AUD/USD can soften. That’s why this weekly technical outlook looks at AUD/USD in relation to both DXY and broader commodity tone.
Weekly Structure: Support, Resistance, and Holding Power
If AUD/USD is holding above a major weekly support zone, that area becomes important for trend continuation. If the pair keeps failing at the same resistance zone, that resistance becomes the line in the sand. A clean AUD/USD weekly technical outlook often comes down to whether price can close beyond those zones.
Momentum: When AUD/USD Has Real Follow-Through
AUD/USD trends tend to look smooth when momentum supports them. If RSI improves on pullbacks and price keeps closing strong, it suggests the move has depth. If RSI weakens while price grinds higher, it can signal exhaustion. The goal is not to overcomplicate your weekly technical outlook, but to make it more reliable.
Oil Weekly Technical Outlook: Fast Moves, Clear Zones
Oil can move sharply, but it still respects structure. In an Oil weekly technical outlook, it helps to use wider zones instead of tight lines, because Oil often overshoots and then decides.
Trend vs. Range in Oil: Two Different Playbooks
In a trend, Oil often breaks above resistance and then retests it as new support. That retest can become a key decision point. In a range, Oil often swings between boundaries with aggressive volatility. A strong Oil weekly technical outlook recognizes which environment you’re in before choosing a strategy.
Weekly Close Confirmation: The Difference Between a Breakout and a Trap
Oil breakouts can be convincing intraday and still fail by the weekly close. That’s why weekly confirmation matters. A strong weekly close above resistance increases the probability of follow-through. A breakout that collapses back into the range increases the probability of reversal. This simple rule improves the readability and usefulness of an Oil weekly technical outlook.
Cross-Market Summary: How These Charts Talk to Each Other
The best trading clarity often comes when markets agree. If DXY is strengthening and EUR/USD is weakening at resistance, the dollar theme is consistent. If Oil is rising and inflation expectations feel firmer, that can influence how traders position in currencies and safe havens. If Bitcoin is breaking out while the dollar is weakening, it can reflect improving liquidity conditions.
This weekly technical outlook becomes most actionable when you look for alignment, not perfection. One market can diverge from the others, but when multiple charts point in the same direction, the probability of trend continuation often improves.
Conclusion: A Weekly Technical Outlook You Can Actually Use
This Gold, Bitcoin, DXY, EUR/USD, AUD/USD, and Oil weekly technical outlook is built to be readable and practical. Start with the weekly trend. Mark the major support and resistance zones. Wait for the weekly close to confirm breakouts or rejections. Use RSI and MACD as supporting evidence, not the main story.
Most importantly, let the market come to your levels. When you stop chasing and start reacting to decision zones, your process becomes calmer and more consistent. That’s what a solid weekly technical outlook should deliver.
FAQs
Q: What makes a weekly technical outlook more reliable than daily analysis?
A weekly technical outlook reduces noise and highlights major zones that larger participants watch, making breakouts and reversals easier to confirm.
Q: Should I trade immediately when price hits support or resistance?
Not usually. A better weekly technical outlook approach is to wait for confirmation through candle structure and weekly closes.
Q: Why does DXY matter so much for EUR/USD and AUD/USD?
Because DXY reflects broad dollar strength. In a cross-asset weekly technical outlook, dollar direction often influences major FX pairs.
Q: Can Gold and Bitcoin rise at the same time?
Yes. While they respond to different drivers, both can benefit when liquidity improves or when markets seek alternatives. Your weekly technical outlook should focus on their charts, not assumptions.
Q: How do I avoid false breakouts in Oil and Bitcoin?
Use the weekly close. In a strong weekly technical outlook, a breakout is more trustworthy when it closes beyond the level and shows follow-through afterward.
See More: 5 Warning Signs Across Bitcoin, Gold, and Global Markets