Cardano Price Bearish Downside Risk Builds
Cardano price remains bearish as weak structure, fading demand, and key support tests hint at further downside. Here’s what traders should watch.
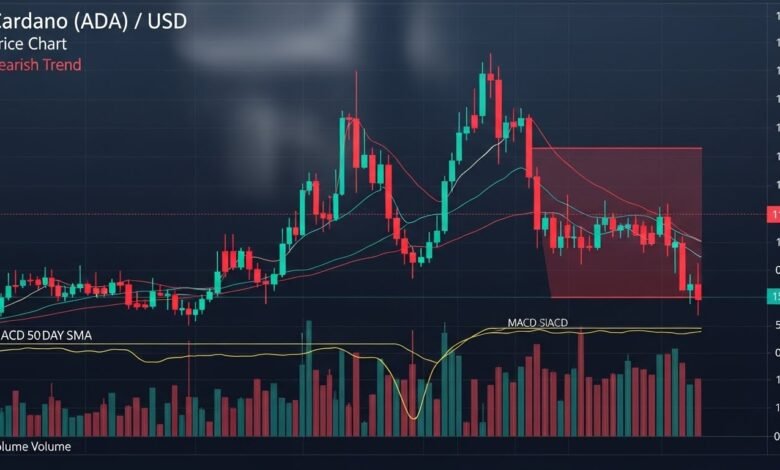
The Cardano price has struggled to regain bullish momentum as the broader crypto market continues to rotate between short-lived relief rallies and persistent sell pressure. Despite occasional spikes in buying activity, the Cardano price remains bearish, and the chart structure continues to suggest that sellers still control the trend. For investors and traders, this matters because market structure often provides clearer direction than headlines, hype, or social sentiment.
When the market is trending upward, price typically forms higher highs and higher lows. In a downtrend, the opposite occurs: lower highs and lower lows define the direction. Right now, the Cardano price appears locked inside a bearish structure where recovery attempts get rejected at key resistance levels, and support zones are tested repeatedly. That pattern is important, because repeated tests of support often weaken it over time, increasing the probability of a breakdown.
This article explores why the Cardano price remains bearish, what the current market structure implies, and which levels traders commonly monitor during potential continuation moves. You’ll also learn how liquidity, trend confirmation, and volume behavior can signal whether downside risk is expanding or exhaustion is approaching. While no technical analysis guarantees outcomes, market structure gives you a disciplined way to think about probabilities—especially when emotions are running high.
Understanding why Cardano price remains bearish
The simplest reason the Cardano price remains bearish is that the market has not yet shown consistent evidence of trend reversal. Many traders make the mistake of assuming that a dip automatically creates value or that a long downtrend must “soon” end. In reality, trends can persist longer than expected, particularly when market participants are still de-risking, liquidity is thin, and capital is rotating into stronger narratives.
A bearish market is often supported by three forces working together: weak demand, overhead supply, and declining confidence. In Cardano’s case, the Cardano price has frequently faced resistance where previous buyers got trapped. When the price revisits those levels, many participants use the opportunity to exit at break-even, adding selling pressure and reinforcing the bearish structure.
Another important factor is sentiment. In downtrends, even neutral news can be interpreted negatively because traders are already positioned defensively. That’s why the Cardano price remains bearish even when short-term indicators appear oversold. Oversold conditions can lead to bounces, but bounces are not the same as reversals.
Market structure: the main signal pointing to further downside
Market structure is essentially the “story” the chart tells. It shows who is in control—buyers or sellers—and whether that control is strengthening or weakening. Right now, the structure behind the Cardano price indicates that sellers are still dictating direction.
A bearish structure typically includes consistent lower highs, where each recovery rally fails below the previous one. This is a sign that demand is either unwilling or unable to push through resistance. At the same time, lower lows show that sellers are comfortable pressing price into new territory, suggesting confidence in the downtrend.
Because the Cardano price remains bearish, many traders treat rallies as potential selling opportunities unless the market proves otherwise. That is why structure matters: it forces market participants to respect what price is actually doing, not what they hope it will do.
Lower highs and lower lows keep the trend intact
When the Cardano price forms a lower high, it signals that buyers did not have enough strength to overcome previous resistance. When that lower high is followed by a lower low, the downtrend becomes more entrenched. This sequence often creates a cascading effect: stop-losses trigger below key lows, liquidity sweeps accelerate, and momentum traders join the move.
Even if the Cardano price remains bearish, short-term rebounds are normal. Markets do not move in straight lines. But as long as rebounds fail to create a higher high, the structure remains bearish. The market is essentially saying, “We are not ready to switch direction yet.”
Structure breaks and what they would look like for ADA
A true structural reversal would require the Cardano price to stop printing lower lows and start forming higher highs. Typically, traders look for a break of structure above a key swing high, followed by a successful retest that holds as support. Without that shift, rallies are often categorized as bear market rallies or dead-cat bounces.
If ADA cannot reclaim and hold a major resistance zone, the argument that the Cardano price remains bearish stays strong. Structure changes do happen—but only after buyers consistently defend higher levels and force sellers to retreat.
Key support and resistance zones shaping Cardano price action
The Cardano price tends to react strongly around zones where liquidity clusters. These zones are often created by previous consolidation ranges, high-volume nodes, or psychological levels that attract attention. Support levels matter because they represent areas where buyers previously stepped in. Resistance matters because it is where sellers previously overwhelmed buyers.
In a bearish market, resistance zones become more powerful because they represent “overhead supply.” Traders who bought higher often sell into rallies to reduce losses. That supply can cap upside progress and keep the Cardano price under pressure.
Support retests can weaken over time
A common misconception is that support gets stronger with each test. In reality, repeated tests can drain buying interest and reduce available bids. Each time the Cardano price revisits a support zone, it gives sellers another chance to push through.
This is why the phrase “support becomes weaker the more it’s tested” is so common among technical traders. If the Cardano price remains bearish, repeated support tests can signal growing downside probability rather than stability.
Resistance flips are the clearest bullish confirmation
One of the strongest signs that a downtrend is ending is a resistance flip, where price breaks above resistance and later holds that same area as support. Traders often watch for this behavior because it shows a meaningful change in order flow.
If the Cardano price fails at resistance again, it reinforces the bearish thesis. But if ADA decisively reclaims a major resistance zone and holds it, market structure could begin shifting away from “bearish continuation” and toward “trend transition.”
Momentum and trend indicators confirm bearish conditions
While market structure is often the most reliable framework, indicators can add confirmation. When the Cardano price remains bearish, several common tools tend to reflect that reality through downward bias.
Many traders watch moving averages, RSI, MACD, and trend strength measures to gauge whether sellers are still dominant. However, indicators should support the structure, not replace it. In strong downtrends, indicators can stay bearish for extended periods, and oversold readings may not lead to sustained reversals.
Moving averages and bearish alignment
When price trades below key moving averages—especially longer-term ones like the 200-day moving average—many traders interpret that as a bearish regime. In addition, if shorter moving averages remain below longer ones, that “bearish alignment” suggests the trend is still down.
As long as the Cardano price remains bearish, rallies that fail near key moving averages often become opportunities for sellers to re-enter with defined risk.
RSI oversold doesn’t guarantee reversal
The Relative Strength Index (RSI) can show oversold conditions, but oversold does not automatically mean “buy.” In persistent downtrends, RSI can remain depressed while price continues falling. Oversold conditions are more useful as a signal to watch for potential bounce setups, not as proof that the bottom is in.
In other words, even if the Cardano price looks oversold, the market can stay bearish until structure confirms a change.
Liquidity, order flow, and why downside moves can accelerate
Crypto markets are heavily influenced by liquidity. When liquidity is deep and balanced, price moves can be smooth. When liquidity is thin—especially during risk-off environments—price can drop quickly as stop-losses cascade and buyers step away.
The Cardano price can experience sharp downside moves when the market “sweeps” liquidity below obvious lows. These sweeps often occur around support zones where many traders place stop-loss orders. When those stops trigger, they turn into market sell orders, pushing price lower and reinforcing why the Cardano price remains bearish.
Stop hunts and liquidity sweeps below key lows
Liquidity below swing lows is like a magnet. Large players and algorithms often target these areas because they contain clustered orders. A liquidity sweep can occur when price dips below a low, triggers stops, and then rebounds. But sometimes the sweep is not a fake-out—it becomes a true breakdown.
If the Cardano price remains bearish, a break below a widely watched support zone could lead to accelerated selling as stops trigger and momentum traders join.
Volume behavior reveals conviction
Volume matters because it shows whether a move has participation. A breakdown with strong volume is more convincing than a breakdown on weak volume. Similarly, a rally that lacks volume often fades quickly, especially in a bearish regime.
If the Cardano price drops while volume expands, it’s a warning sign that sellers are active and conviction is rising. If volume shrinks during declines, it could indicate seller exhaustion—but structure still needs to confirm reversal before traders assume the trend is changing.
Macro environment and crypto sentiment keep pressure on Cardano price
Crypto does not trade in isolation. Broader market sentiment—risk-on vs. risk-off—often influences altcoins more intensely than it influences Bitcoin. When the market becomes defensive, capital tends to flow toward perceived “safer” crypto assets or even out of crypto entirely.
In such conditions, the Cardano price remains bearish partly because traders prefer liquidity and momentum. Altcoins can suffer when speculative appetite declines. That doesn’t mean Cardano lacks long-term potential, but it does mean price action can remain suppressed until market conditions improve.
In bearish macro phases, strong projects still decline. This is why traders separate fundamental belief from tactical positioning. You can believe in Cardano’s ecosystem while still acknowledging that the Cardano price is currently operating within a bearish structure.
Scenarios for the next move: continuation vs. reversal
The future path of ADA will likely fit into one of two broad scenarios. Either the bearish structure continues, leading to further downside, or the market shifts structure and begins building a base for reversal.
Because the Cardano price remains bearish, traders often treat downside continuation as the higher-probability scenario until the chart proves otherwise.
Bearish continuation scenario: breakdown and lower lows
If the Cardano price breaks below a major support zone and fails to reclaim it, the downtrend may extend. In this scenario, rallies could remain corrective, and sellers may continue defending resistance levels.
A continuation phase often includes lower lows, weak bounces, and a gradual grind downward punctuated by sharp drops. This is common when liquidity is thin and buyers are reluctant to step in early.
Reversal scenario: break of structure and strong reclaim
For a bullish reversal, the market generally needs a clear break above a prior swing high, followed by a retest that holds. This often coincides with stronger volume, improving sentiment, and evidence that buyers are absorbing sell pressure.
If ADA can reclaim a key resistance zone and sustain it, the statement that the Cardano price remains bearish becomes less accurate over time. But the market must demonstrate that shift through structure—not just through hope.
Risk management tips for trading a bearish Cardano price trend
Even though this article focuses on analysis, it’s worth emphasizing that bearish markets can be dangerous for both bulls and bears. Volatility, fake-outs, and sudden squeezes are common. Traders who succeed during these conditions usually rely on strict risk management and clear invalidation points.
When the Cardano price remains bearish, chasing bottoms can be costly. Many experienced traders wait for confirmation, even if it means missing the absolute low. Confirmation helps reduce the risk of catching falling knives.
At the same time, shorting in late-stage downtrends can also be dangerous due to sharp rebounds. The key is to trade setups, not emotions, and to respect the structure until it changes.
Conclusion
The Cardano price remains bearish because market structure continues to favor sellers, with lower highs and lower lows shaping the trend. Support zones are being tested repeatedly, and without a clear break of structure and resistance reclaim, downside risk remains elevated. While oversold signals and short-term bounces are possible, they do not automatically indicate a trend reversal.
For traders, the most important takeaway is simple: respect the structure. Watch how ADA behaves at major support and resistance zones, monitor volume during key moves, and look for signs of a genuine trend shift rather than temporary relief rallies. Until the market proves otherwise, the bearish narrative remains dominant—and the probability of further downside stays on the table.
FAQs
Q: Why does the Cardano price remain bearish right now?
The Cardano price remains bearish mainly because the chart still shows a downtrend with lower highs and lower lows. Rallies have been rejected at resistance, and support zones are being tested repeatedly, which can lead to breakdown risk.
Q: What is market structure and why does it matter for ADA?
Market structure describes the pattern of highs and lows that defines a trend. It matters because it shows whether buyers or sellers control momentum. As long as the Cardano price keeps printing lower highs and lower lows, structure suggests further downside is more likely than a lasting recovery.
Q: Can RSI being oversold mean Cardano will bounce?
RSI oversold conditions can lead to a bounce, but they do not guarantee a reversal. In strong downtrends, RSI can stay low while the Cardano price remains bearish and continues to fall. Structure confirmation is more reliable.
Q: What would confirm a bullish reversal for Cardano price?
A bullish reversal typically requires a break above a key swing high, followed by a successful retest that holds. A strong reclaim of major resistance with higher volume can also signal that the Cardano price is transitioning away from bearish control.
Q: Is it risky to buy ADA while Cardano price remains bearish?
It can be risky because downtrends often continue longer than expected. Many traders prefer waiting for structure confirmation before buying. If you do buy while the Cardano price remains bearish, having a clear plan, defined risk, and realistic expectations is essential.
Also Read: Altcoin Market News for Traders 2025 Updates Trading