
Bitcoin Stuck in a Triangle — Calm Before a 15% Storm?
Bitcoin is consolidating in a triangle, signaling volatility compression and a potential 15% move. Here’s what traders are watching as BTC nears a decision point.

Bitcoin has a habit of going quiet right before it gets loud. Traders see it again and again: a stretch of shrinking price swings, headlines calling it “boring,” and then—suddenly—one decisive candle that changes the mood across the market. Right now, many chart watchers believe Bitcoin is doing exactly that, compressing into a triangle pattern that signals indecision but also stores energy for a larger move. When Bitcoin is consolidating in a triangle, the market is essentially negotiating a new equilibrium between buyers and sellers, and that negotiation tends to end with a clear winner.
This kind of consolidation can feel confusing because it often includes fake-outs, choppy intraday moves, and short bursts of momentum that quickly fade. Yet from a market-structure point of view, a triangle is one of the clearest ways to visualize a tightening range. Volatility contracts, the highs come down, the lows come up, and price action begins to coil. Traders call this “compression,” and compression frequently precedes expansion. That’s why the question on so many desks is not whether Bitcoin will move, but how far—and in what direction—once the triangle resolves.
The “15% move” idea comes from a simple observation: when price action compresses into a recognizable structure, the eventual breakout or breakdown can travel a distance that reflects the size of the prior range. In other words, the market is building a spring, and once released, it often reaches for liquidity pockets above resistance or below support. While no pattern guarantees anything, triangles are widely followed, which matters because widely watched structures can become self-reinforcing. Breakouts attract momentum traders, stops get triggered, and positioning flips quickly.
In this article, we’ll unpack what it means when Bitcoin is consolidating in a triangle, why a 15% move is plausible, and how to think about the next phase using support and resistance, volume behavior, momentum indicators, and broader catalysts. We’ll keep it practical: what a triangle actually is, what signs confirm a real move, where traders often get trapped, and what to watch if Bitcoin decides to surprise the crowd.
Triangle Pattern in Bitcoin
When people say Bitcoin is consolidating in a triangle, they’re usually referring to a structure where the market draws progressively lower swing highs and progressively higher swing lows. This “squeezing” creates a converging shape. The most common versions are the symmetrical triangle, the ascending triangle, and the descending triangle. In a symmetrical triangle, both sides slope toward each other, hinting at balance rather than a built-in bullish or bearish bias.
Bitcoin is especially prone to triangle formations because it trades 24/7, reacts quickly to macro headlines, and has deep derivatives markets that amplify short-term positioning. The result is a chart that often “breathes” in waves: trend, pause, compress, then trend again. A triangle is that pause in its most visual form.
A key point is that a triangle is not a prediction by itself. It’s a map of current behavior: volatility contracting, liquidity building, and decision-making narrowing. The prediction comes from how Bitcoin behaves at the boundaries of the triangle—how it reacts when price taps the upper trendline (resistance) and the lower trendline (support). If sellers consistently defend the upper line, the highs will keep descending. If buyers keep stepping in at higher prices, the lows will rise. Eventually, there isn’t enough room left for both sides to keep playing defense.
Symmetrical Triangle vs. Ascending and Descending Triangles
A symmetrical triangle suggests that both bulls and bears are willing to participate, but neither is confident enough to chase aggressively. This often happens when Bitcoin is waiting for a catalyst: a major macro data print, a shift in risk appetite, regulatory news, or a sudden change in liquidity.
An ascending triangle typically features flat resistance with rising lows. That can hint at accumulation because buyers are willing to pay higher prices, pressing against a clear ceiling. A descending triangle is the opposite: flat support with falling highs, often associated with distribution.
In real life, Bitcoin patterns aren’t always textbook. Trendlines may be slightly messy, and different timeframes can show different “triangles” at the same time. That’s why it’s helpful to pair the triangle with other tools—especially volume, momentum, and market structure—to avoid overconfidence.
Why Bitcoin Consolidating in a Triangle Often Precedes a Big Move
When Bitcoin is consolidating in a triangle, it’s doing something very specific: reducing its average true range, compressing candles, and spending more time in the middle of the range than at the extremes. This creates a sense of calm that can be misleading. In market terms, calm is often just positioning.
In compression phases, traders layer limit orders around key levels, stop-loss clusters form near trendlines, and options dealers adjust hedges as implied volatility shifts. The triangle becomes a magnet for liquidity because everyone sees the same boundaries. That shared attention matters. When Bitcoin breaks out of the triangle, it’s not just “moving”; it’s also triggering a cascade of orders.
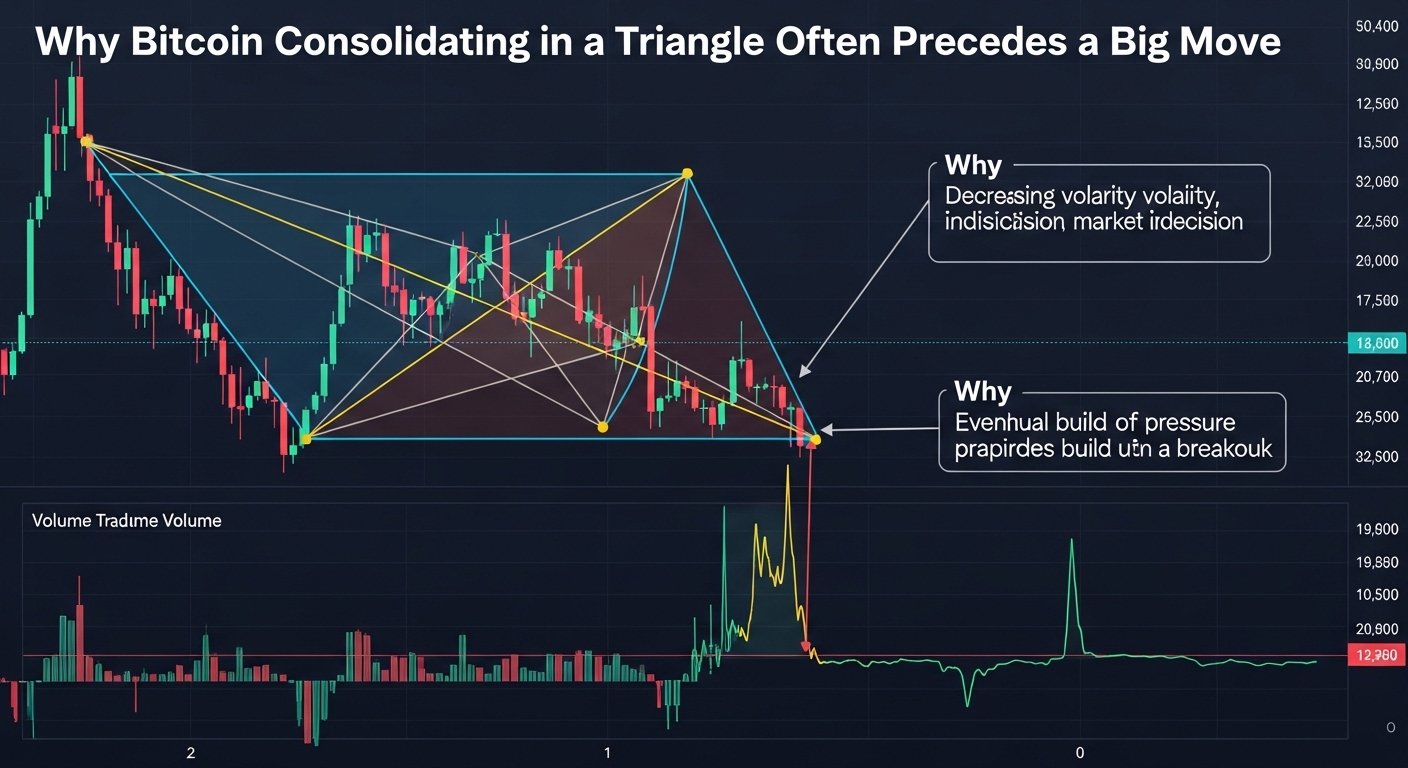
A triangle resolution can accelerate because of three forces working together. First, breakout traders enter in the direction of the move. Second, traders on the wrong side exit, turning into fuel. Third, sidelined participants who waited for confirmation jump in. In Bitcoin, this can happen quickly due to perpetual swaps and high leverage availability.
The Volatility Compression Effect
The simplest way to understand the 15% move concept is to think of volatility as energy. During a triangle, volatility contracts—daily ranges shrink, and price becomes more orderly. But markets rarely stay compressed forever. Bitcoin has a long history of regime shifts where quiet conditions transition into large directional trends.
When that transition begins, it can be dramatic. If the triangle has been forming over a meaningful period on a higher timeframe, the “stored energy” can be larger. That doesn’t mean every triangle leads to a 15% move, but it does explain why traders take the possibility seriously.
Key Technical Levels That Matter Inside the Triangle
No triangle exists in isolation. The most important levels are usually the swing highs and swing lows that define the trendlines, plus horizontal areas where Bitcoin has repeatedly reacted. Those zones represent areas of support and resistance that remain relevant even after the triangle breaks.
When Bitcoin is consolidating in a triangle, many traders watch for a clean close beyond the trendline rather than a wick. Wicks can be stop-runs, especially in crypto. A decisive close—paired with expanding volume—often carries more weight. Another key idea is “confluence.” If the triangle’s upper boundary aligns with a major moving average, prior high-volume node, or previous breakdown level, it becomes more meaningful. The same is true for the lower boundary if it aligns with a prior demand zone or a long-term trendline.
How Volume Should Behave in a Healthy Triangle
Classic technical analysis suggests volume should decline as the triangle develops, reflecting reduced participation as price compresses. In Bitcoin, volume patterns can be noisier, but the principle still helps: a breakout with clearly stronger volume than recent sessions is often more credible than a breakout on thin participation.
If Bitcoin pops above the triangle but volume stays muted, the move can fail. Failed breakouts are common because liquidity hunts are part of crypto’s personality. That’s why many traders look for both the initial break and then a retest that holds. A strong retest can flip old resistance into new support, reinforcing the breakout narrative.
Is a 15% Move Next for Bitcoin?
A 15% move is plausible in Bitcoin because it’s a naturally volatile asset, and triangles frequently resolve into moves that seek nearby liquidity. The question is whether the current structure supports that kind of expansion. To evaluate that, traders often estimate the “measured move” by taking the height of the widest part of the triangle (or the prior range that fed into it) and projecting it from the breakout point.
Even without doing strict geometry, you can think in terms of market behavior: if Bitcoin is consolidating in a triangle after a strong trend, the breakout may try to continue that trend. If it’s consolidating after a choppy period, the market might still be deciding on direction, which can make the first break more likely to fake out.
The 15% target isn’t magic; it’s a way to quantify the potential if Bitcoin shifts from compression to expansion. What matters more is whether the breakout is supported by momentum, whether the market holds key levels after the move, and whether broader conditions support risk-taking.
Bullish Scenario: Breakout, Retest, Continuation
In a bullish resolution, Bitcoin pushes above the triangle’s upper boundary, closes firmly, and then either continues immediately or retests the trendline from above. If that retest holds, traders often interpret it as confirmation that bullish momentum is returning. At that point, Bitcoin may begin to target overhead liquidity—areas where previous sellers defended or where trapped shorts have stops.
A bullish breakout tends to look “clean” on the chart: candles expand, pullbacks are shallow, and dips get bought quickly. You may also see improving breadth across the crypto market, with majors and high-quality altcoins stabilizing rather than dragging Bitcoin lower.
Bearish Scenario: Breakdown and Demand Test
In a bearish resolution, Bitcoin loses the triangle’s lower boundary and struggles to reclaim it. A breakdown doesn’t automatically mean a crash, but it often signals that buyers have stepped back and the market needs to test deeper demand. If Bitcoin breaks down, traders look for where prior demand zones sit and whether the market forms a base quickly.
Bearish moves can also be accelerated by long liquidations, particularly if leverage was elevated during the consolidation. If Bitcoin is consolidating in a triangle while funding rates creep up and longs get crowded, a breakdown can become a fast flush before stabilizing.
Confirmation Signals Traders Watch Before Trusting the Move
Because Bitcoin is famous for fake-outs, many traders demand confirmation beyond the trendline break. One of the most common confirmation tools is momentum. If RSI begins trending upward into a breakout and holds strength, that can support a bullish case. If RSI diverges or fails to reclaim key levels, that can be a warning sign.
Another signal is market structure. A bullish breakout that also reclaims a prior swing high can be more meaningful than a breakout that barely clears the line. Similarly, a bearish breakdown that also breaks a key swing low tends to carry more weight.
Traders also pay attention to derivatives data, even informally: funding rates, open interest, and whether moves appear driven by spot buying or leveraged speculation. When Bitcoin is consolidating in a triangle, positioning can become crowded. The breakout often reveals which side was overstaying.
The Role of Liquidity and “Stop Zones”
Triangles concentrate stop orders. Above the upper trendline, stops from shorts accumulate. Below the lower trendline, stops from longs accumulate. When Bitcoin touches those areas, it can trigger rapid moves that look like breakouts but are really liquidity sweeps. That’s why retests matter. A real breakout often survives a retest because demand is genuine. A fake-out often collapses back into the triangle quickly, trapping late entries and restoring the range.
Macro and Fundamental Catalysts That Can Trigger the Triangle Resolution
While triangle patterns are technical, Bitcoin does not trade in a vacuum. Macro conditions influence whether breakouts get follow-through. Interest rate expectations, dollar strength, equity market sentiment, and liquidity conditions can all shape Bitcoin’s willingness to trend.
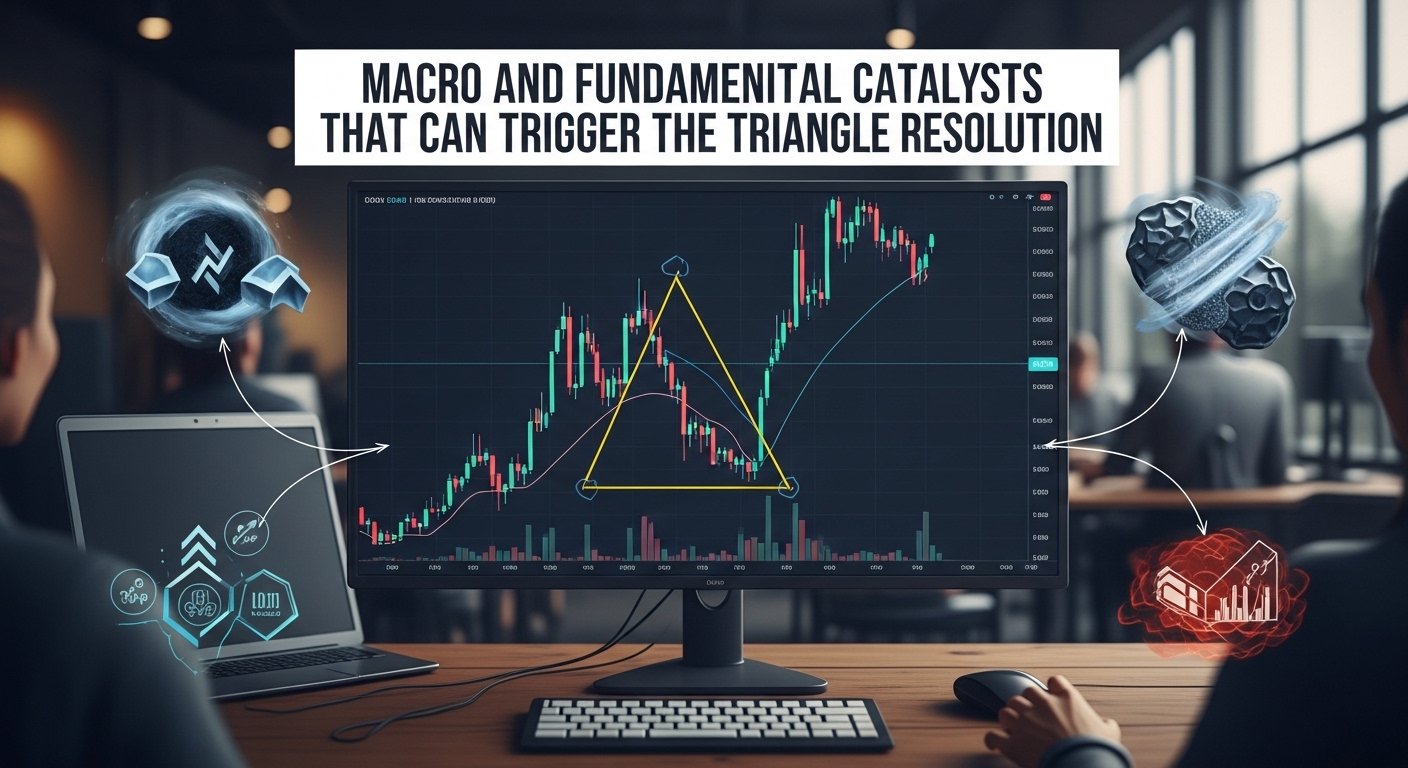
Bitcoin is also sensitive to crypto-specific catalysts. Headlines around regulation, institutional adoption, and exchange flows can shift sentiment quickly. If on-chain data suggests large holders are accumulating or moving coins off exchanges, that can support a bullish interpretation. If inflows to exchanges rise sharply, it can hint at distribution. Even narratives like spot ETF demand, institutional rebalancing, or changes in miner behavior can become the “spark” that resolves a triangle. The pattern sets the stage; the catalyst cues the audience.
How Sentiment Shifts During Consolidation
During a triangle, sentiment often flips back and forth. Bulls see the higher lows and call it accumulation. Bears see the lower highs and call it weakness. This tug-of-war is normal. The most useful approach is to recognize that sentiment inside a triangle is often noisy and reactive. What matters is how Bitcoin behaves when it finally commits.
If Bitcoin is consolidating in a triangle and sentiment becomes extremely one-sided, that can be a contrarian signal. Crowded narratives can lead to sharp squeezes in the opposite direction. This is another reason the 15% move concept remains on the table: when positioning is lopsided, the unwind can be powerful.
Practical Risk Management for Trading a Bitcoin Triangle
Whether you’re a trader or a long-term investor, triangles can tempt you into overtrading. The range is tight, price is active, and it feels like something is about to happen every day. But the best opportunities often come from patience and clarity. Traders often choose between two approaches: anticipating the break or waiting for confirmation. Anticipation can offer better entry prices but carries higher fake-out risk.
Confirmation can reduce false signals but may mean entering after the move has started. Neither is “right” universally; the key is aligning your strategy with your risk tolerance. It’s also worth remembering that Bitcoin can break a triangle and still chop. Sometimes it breaks, runs a bit, and then pauses again. That doesn’t invalidate the pattern; it just means the market is layering decisions. If your plan assumes one clean impulse, you may get shaken out by normal volatility.
Timeframe Alignment Matters
A triangle on a 15-minute chart might look dramatic but can resolve into noise on the daily chart. Conversely, a triangle visible on the daily chart can dominate price action for weeks. When Bitcoin is consolidating in a triangle, always ask which timeframe is controlling the narrative. Long-term participants may treat the triangle as a short-term structure within a broader trend. Short-term traders may treat it as the main event. Both can be reasonable, but mixing timeframes without realizing it is a common source of poor decisions.
What Comes After the Breakout: The Two-Phase Move
In Bitcoin, the move after a triangle often has two phases. The first is the breakout impulse, which can be sharp and emotional. The second is the reaction—either a continuation or a mean-reversion pullback. Many traders get trapped by phase one because they chase the first candle and place stops too close. Others miss the move because they refuse to believe it until it’s far gone.
If Bitcoin breaks out and then retests successfully, that retest can offer a cleaner entry for those who prefer confirmation. If Bitcoin breaks out and never looks back, it can signal strong demand and a market that is eager to trend. A breakdown can behave similarly. The initial drop can be violent, followed by a bounce that tests the underside of former support. If that test fails, the market may continue lower. If it succeeds and reclaims the triangle, the breakdown may become a bear trap.
Why 15% Is a Meaningful Psychological Threshold
A 15% move in Bitcoin is large enough to change sentiment but small enough to be common in trending phases. It can flip headlines, shift funding, and force repositioning. It’s also the kind of move that can happen quickly if liquidity is thin or if derivatives are crowded. That’s why, when Bitcoin is consolidating in a triangle, the market pays close attention. The structure hints that a decision is near, and the magnitude of the next move could be significant enough to matter for both traders and investors.
Conclusion
When Bitcoin is consolidating in a triangle, it’s telling a clear story: volatility is compressing, buyers and sellers are negotiating tighter boundaries, and the market is approaching a point where it must choose direction. A 15% move is not guaranteed, but it’s entirely plausible given how Bitcoin tends to transition from low-volatility consolidation into high-volatility expansion.
The most important takeaway is to focus less on predicting the direction and more on reading confirmation: a decisive break, supportive volume, strong momentum, and behavior at key support and resistance zones. Whether the triangle resolves upward or downward, the next chapter is likely to be more dynamic than the quiet that came before.
FAQs
Q: What does it mean when Bitcoin is consolidating in a triangle?
It means Bitcoin is trading within a tightening range where swing highs are falling and swing lows are rising (or a variation of that structure). This reflects reduced volatility and indecision that often precedes a larger move.
Q: Do triangle patterns work reliably in Bitcoin?
They can be useful, but Bitcoin is prone to false breakouts due to liquidity sweeps and leverage. Triangles are best used with confirmation tools like volume, market structure, and momentum indicators such as RSI.
Q: How do traders estimate a 15% move from a triangle?
Many use a measured-move concept, projecting the height of the earlier range or widest part of the triangle from the breakout point. Others focus on nearby liquidity zones and historical volatility to gauge plausible travel distance.
Q: What confirms a real breakout instead of a fake-out?
A real breakout often shows a strong close beyond the trendline, expanding volume, and a retest that holds the broken level as new support and resistance. Fake-outs frequently snap back into the triangle soon after the break.
Q: Is it better to trade the breakout or wait for a retest?
Trading the breakout can capture more of the initial move but carries higher fake-out risk. Waiting for a retest can reduce false signals but may mean entering later. The better choice depends on your risk tolerance and timeframe.