Bitcoin Holders Underwater as Loss Supply Hits Extremes
Bitcoin holders underwater are surging as supply in loss nears historic extremes. Explore what on-chain signals mean for BTC’s next move.

Bitcoin is often described as a market driven by narratives, but under the surface it is equally driven by numbers that reflect human behavior. One of the most revealing numbers is how many Bitcoin holders underwater exist at any moment. When the market price drops below a large portion of investors’ cost basis, more coins are effectively “in loss,” and sentiment shifts from optimism to caution. That shift can change everything: how quickly traders sell, how long rallies last, where resistance forms, and how confident buyers feel about stepping in.
What makes the current conversation especially intense is the idea that supply in loss has spiked to levels that feel like “historic extremes.” Whether you’re a long-term investor, a swing trader, or simply someone trying to understand why the market behaves the way it does, this concept matters. It matters because underwater supply is not just a statistic—it is potential selling pressure, potential capitulation, and potential future fuel for a recovery, all at once.
When Bitcoin holders underwater increases, a psychological line is crossed. People who felt comfortable holding through small dips begin to reconsider. Newer buyers start checking charts more often. Long-term holders become more selective and patient, sometimes choosing to sit tight rather than realize a loss. Meanwhile, on-chain data provides a window into that collective stress by estimating how much of the circulating supply is held at prices higher than today’s market price.
In this article, we’ll break down what it means when Bitcoin holders underwater grows rapidly, why supply in loss can reach extreme levels, and how these conditions tend to shape price action. We’ll also explore the difference between short-term and long-term holders, the role of cost basis, the formation of overhead resistance, and the signals that often appear when markets transition from pain into stabilization. By the end, you’ll have a clearer framework for reading underwater supply without panic and without false certainty.
Bitcoin Holders Underwater and Supply in Loss
The phrase Bitcoin holders underwater refers to investors whose BTC is currently worth less than what they paid for it. In traditional markets, you might estimate this using account-level purchase prices. In Bitcoin, analysts often estimate it using on-chain models that track when coins last moved and what the market price was at that time. While no metric is perfect, the goal is to approximate unrealized losses across the network in a way that reflects market psychology.
Supply in loss is the supply-side version of the same idea. It describes the amount of Bitcoin supply that is currently held at an unrealized loss. When supply in loss rises, it means more coins belong to Bitcoin holders underwater, and the network’s aggregate “pain level” is increasing.
Why This Metric Is More Than a Mood Indicator
It’s tempting to treat underwater metrics as emotional headlines, but they have direct structural implications. When Bitcoin holders underwater increases, many market participants anchor their decision-making to their entry price. This anchoring effect creates predictable behaviors. Some holders sell quickly to avoid deeper losses. Others refuse to sell until they reach break-even, turning their cost basis into a future sell target. Over time, those break-even zones can become price ceilings where rallies slow down. At the same time, underwater conditions can also reduce liquid supply. Many investors are reluctant to sell at a loss, especially long-term participants with higher conviction. That reluctance can tighten available supply and set the stage for sharper moves once demand returns.
The Difference Between Being Underwater and Being Doomed
A rising number of Bitcoin holders underwater does not automatically mean the market is headed for collapse. Markets frequently spend time with a large share of supply in loss, especially during transitions between bullish and bearish regimes. What matters is the direction of change, the speed of that change, and which groups of holders are experiencing the most stress. In other words, supply in loss is a context tool. It tells you where pressure is building and where structural friction might appear, not a guaranteed prediction of the next candle.
Why Supply in Loss Spikes to Historic Extremes
When people say supply in loss has reached historic extremes, they are pointing to an unusually large share of the circulating supply held at a loss relative to its estimated acquisition price. These spikes tend to happen when price falls below widely shared entry zones, especially after periods of aggressive buying near local highs.
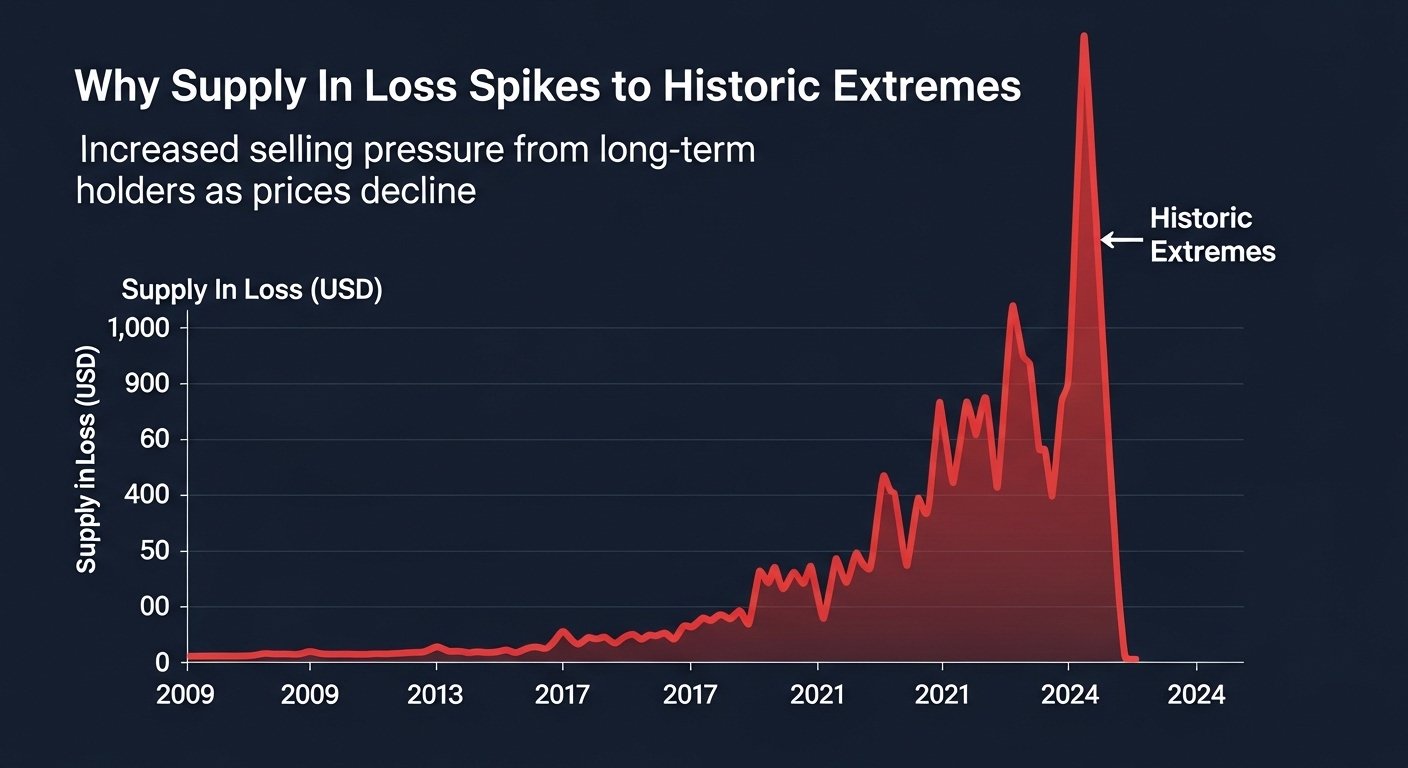
Bitcoin cycles often create “crowded” cost bases. During euphoric phases, many buyers enter at similar prices. If price later drops through those zones, a large cohort of Bitcoin holders underwater is created almost simultaneously. That’s when loss supply can surge quickly and dramatically.
Cost Basis Clustering and Market Memory
Cost basis is one of the most important concepts in understanding why loss supply becomes extreme. If a significant portion of market participants accumulated BTC around the same region, that region becomes a type of collective memory. When price falls below it, the market experiences a sudden expansion of underwater holders. When price later rises back toward it, that same region may act as resistance, because many holders sell to reclaim their principal. This is how on-chain data and technical analysis often converge. On-chain cost basis zones and chart resistance zones frequently align because both are expressions of the same reality: people remember where they bought.
Liquidity Shocks and Forced Selling
Extreme spikes in Bitcoin holders underwater are often accelerated by liquidity events. When liquidity dries up, price can fall faster than expected. Rapid declines can trigger margin calls and forced selling in leveraged markets, which pushes spot prices lower and pulls more supply into loss. Even if you never trade with leverage, leverage can still affect you because forced selling alters the path of price and sentiment. In these environments, supply in loss becomes a stress map. It reveals how quickly the market’s profitability structure has flipped, and how large the pool of potential sellers might become during recoveries.
Realized Losses vs. Unrealized Losses
It’s also important to separate unrealized losses from realized ones. Bitcoin holders underwater may feel pressure, but pressure doesn’t always become selling. A market can carry enormous unrealized loss for weeks or months if holders choose not to capitulate. Conversely, a smaller underwater cohort can cause big downside if that cohort is highly reactive and sells aggressively. So when you see supply in loss reach extremes, the key question becomes: are holders absorbing the pain, or are they distributing coins into the market?
The Role of Short-Term Holders in Underwater Spikes
Not all underwater holders behave the same. Short-term participants typically respond faster, react more emotionally, and are more likely to sell in response to volatility. That’s why spikes in Bitcoin holders underwater often correlate with short-term holder stress. Short-term holders are usually newer entrants who bought during recent price action. They often use tighter risk limits and may be less committed to holding through drawdowns. When they become underwater, two things can happen. They can capitulate and sell into weakness, creating a sharper drop. Or they can hold and wait, creating a ceiling of overhead supply that slows future rallies.
How Short-Term Losses Create “Fast Pain”
Short-term underwater conditions can produce what feels like “fast pain.” Prices drop, sentiment collapses, and negative narratives intensify. If fear spreads, short-term holders sell, and the selling pushes price lower, which forces even more holders underwater. This feedback loop can create a steep drawdown in a relatively short period.
At the same time, fast pain can also lead to fast stabilization if the market exhausts sellers. When most reactive participants have already sold, the remaining supply is often held by more patient hands. In that scenario, the spike in Bitcoin holders underwater may mark a turning zone where selling pressure begins to fade.
Why Short-Term Underwater Supply Can Become Resistance
If short-term holders do not capitulate, they often become sellers on the rebound. When price returns to their entry zone, many choose to exit at break-even, not because they are bearish, but because they want emotional relief. This is how Bitcoin holders underwater can turn into a future resistance wall. The larger the underwater cohort, the heavier that wall can be. This is one reason why markets can feel “stuck” after sharp drops: rallies meet break-even sellers, and progress slows until the market absorbs that supply.
Long-Term Holders and the “Aging of Losses”
Long-term holders typically have a different psychology. They have seen multiple cycles, understand volatility, and often have lower time preference. When long-term holders become part of the Bitcoin holders underwater cohort, it can signal deeper or more prolonged stress, but it can also signal resilience.
A useful idea in on-chain analysis is that losses can “age.” If price remains below major cost bases for a long period, coins that were bought recently become older holdings over time. What started as short-term stress can transform into long-term underwater supply. This shift changes market behavior because long-term holders are usually slower to sell.
When Long-Term Holders Hold the Line
Long-term holders are not immune to selling, but they tend to sell under different conditions. They may sell into strong rallies, not into weak dips. They may rebalance after major upside, not after sudden downside. If a large portion of Bitcoin holders underwater is composed of long-term participants, it can reduce immediate selling pressure because those holders may be willing to wait longer for recovery. This can tighten the liquid supply available on exchanges and make the market more sensitive to new demand. When demand returns, the rebound can be stronger because fewer coins are readily offered for sale.
When Long-Term Underwater Conditions Signal a Slow Grind
There is another possibility, and it’s less exciting but common: long-term underwater conditions can coincide with a slow grind. Instead of a sharp capitulation and reversal, the market may move sideways or drift lower for an extended period. In that environment, supply in loss can remain high, and Bitcoin holders underwater stays elevated, but the pace of selling decreases. The market becomes fatigued rather than panicked. This is the kind of phase where narratives shift from “crash” to “boredom.” Ironically, boredom is often a stabilizing force, because it reduces impulsive participation and allows the market to rebuild.
Overhead Supply, Break-Even Behavior, and Resistance Zones
One of the most practical uses of Bitcoin holders underwater data is identifying where resistance may form. When many coins are held at a loss, those holders often become sellers when price approaches their break-even point. This creates overhead supply, which can cap rallies and create repeated rejection levels.
Why Break-Even Is a Powerful Magnet
Break-even is emotionally significant. For underwater holders, break-even feels like escape. For traders, it feels like an obvious decision point. As a result, large break-even clusters can shape price behavior even when no single whale is acting. It’s a crowd effect. If supply in loss is extreme, it often means break-even clusters are large too. That increases the probability of choppy price action during recoveries, because rallies must absorb persistent selling from those seeking relief.
How Markets Eventually Break Through
Markets don’t stay trapped forever. Overhead supply gets absorbed in one of two main ways. Either the market spends time consolidating while buyers slowly absorb sellers, or the market experiences a strong demand shock that overwhelms selling pressure quickly. In both cases, the role of Bitcoin holders underwater changes over time. As price rises, more supply flips back into profit, reducing the number of underwater holders and weakening the resistance wall. This is why the trend in underwater supply matters as much as the absolute level. A high level that is shrinking can be constructive. A high level that is still expanding can signal ongoing stress.
Interpreting Historic Extremes Without Overreacting
When you hear that supply in loss is at historic extremes, it’s natural to assume something dramatic must happen next. Sometimes it does. Sometimes it doesn’t. The most useful approach is to treat the metric as a risk map rather than a prophecy.
Focus on Momentum of the Metric
If Bitcoin holders underwater is still rising quickly, the market may still be in the process of discovering where sellers exhaust themselves. If the metric begins to stabilize, it can indicate that price is spending enough time in a zone that the market is absorbing the shock. Stabilization doesn’t guarantee an immediate rally, but it often reduces the odds of sudden, fresh downside spikes.
Consider Depth of Loss, Not Just Presence of Loss
Many loss metrics are binary: a coin is either in profit or in loss. But the depth of loss can vary widely. A small dip below cost basis may create many underwater holders without creating intense capitulation, especially if participants believe the move is temporary. A deeper drawdown can create more severe stress even if the underwater count is similar. That’s why underwater supply is most powerful when combined with other context like volatility, macro liquidity, and signs of seller exhaustion.
Recognize the Two Sides of Underwater Supply
High supply in loss can be bearish because it creates overhead supply and fear. It can also be constructive because it can lead to seller exhaustion and supply tightening. The difference is the market’s ability to attract sustained demand. If demand returns while many coins are locked up by patient holders, upside can be more explosive. This dual nature is exactly why the same metric can be cited by bears and bulls at the same time.
What This Means for Different Types of Bitcoin Participants
The implications of Bitcoin holders underwater depend on your time horizon. Long-term investors, short-term traders, and newcomers all experience underwater conditions differently. For long-term investors, the key is understanding that underwater phases are part of Bitcoin’s history. Extreme supply in loss has often appeared during major transitions. The strategy question becomes whether you can tolerate volatility and maintain a plan that isn’t driven by short-term emotions.
For traders, underwater supply is often most useful for identifying likely resistance zones and recognizing when rallies might stall. If many holders are underwater above current price, price may need time to chew through that overhead supply. For newcomers, the most important lesson is that being underwater is not unique to you. Markets routinely place a large share of participants in loss at various points. The key is risk management and time horizon alignment, not chasing emotional certainty.
Conclusion
When Bitcoin holders underwater rises sharply and supply in loss reaches historic extremes, it signals a market under pressure. It reflects a broad shift in profitability, where many coins are held at unrealized losses and emotions run hotter than usual. These conditions can create downside risk through capitulation, but they can also set the stage for stabilization through seller exhaustion and supply tightening.
The most important insight is that underwater supply is not a single-direction indicator. It is a structural map of stress, cost basis, and potential behavior. High underwater levels can lead to heavy resistance as break-even sellers emerge, yet they can also reduce liquid supply as holders refuse to sell at a loss. Watching how Bitcoin holders underwater changes over time—who is underwater, how quickly the metric moves, and where cost bases cluster—provides a clearer framework than reacting to headlines alone. In markets defined by volatility, clarity often comes from understanding the mechanics behind the emotion. Underwater supply is one of the best tools for doing exactly that.
FAQs
Q: What does it mean when Bitcoin holders are underwater?
It means the current Bitcoin price is below the estimated purchase level for many investors, so their holdings reflect unrealized losses. When more Bitcoin holders underwater exist, market sentiment often shifts toward caution.
Q: Is a spike in supply in loss always a sign the bottom is in?
No. A spike in supply in loss can occur near bottoms, but it can also persist during long consolidation or extended bearish phases. It’s more useful to watch whether Bitcoin holders underwater is still increasing or starting to stabilize.
Q: Why does underwater supply create resistance during recoveries?
Because many underwater holders want to sell at break-even. When price returns to their entry zone, they may exit to recover capital, creating overhead supply that can slow or stop rallies.
Q: How is supply in loss estimated in on-chain analysis?
On-chain models often approximate each coin’s cost basis using the price when it last moved on-chain. If the current price is below that level, the coin is counted as part of supply in loss, increasing the share of Bitcoin holders underwater.
Q: What’s the difference between short-term and long-term holders being underwater?
Short-term underwater holders are usually more reactive and can drive faster selling or quick capitulation. Long-term underwater holders tend to be more patient, which can reduce immediate selling pressure but may also reflect a slower recovery process depending on broader market conditions.