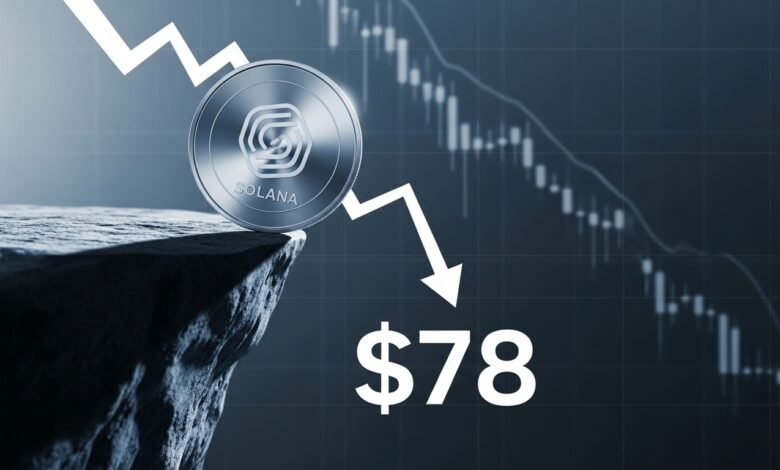
Solana Price Slips $78 Support Comes Into Focus
Solana price returns to its old range as $78 support nears. Explore key levels, indicators, catalysts, and next scenarios for SOL.
Solana price has a reputation for moving fast, but what often matters most is not the speed of a move—it’s where the move ends. Right now, Solana price has slipped back into a familiar zone that traders recognize as an “old range,” and that shift in structure is why attention is tightening around one number: $78. When an asset returns to a previous consolidation area, the market is effectively revisiting a past agreement about value. That past agreement becomes a present-day battleground, especially when price approaches the lower boundary.
In practical terms, Solana price re-entering an old range tells you that recent momentum wasn’t strong enough to build a fresh, higher price floor. Instead of trending cleanly, SOL is negotiating with supply and demand inside a zone where both sides have history. That is exactly why the $78 support comes into focus. It’s not just “a number on a chart.” It’s a potential decision point where buyers may attempt to defend the range and sellers may push for a breakdown that changes the entire short-term narrative.
This matters for more than day traders. Long-term holders watch these inflection points because they often shape sentiment for weeks. A strong hold near support can reset confidence and encourage accumulation. A decisive break can trigger a deeper shakeout and push investors to reassess time horizons. The key is to understand what the old range is communicating, what $78 represents in that context, and how to interpret the signals without getting whipsawed by noise.
The “old range” and why Solana price returned to it
When people say Solana price has slipped back into an old range, they mean SOL is trading again within a prior consolidation zone where price previously moved sideways. A range forms when buyers and sellers repeatedly meet around certain levels, creating a top boundary (resistance) and a bottom boundary (support). Inside that area, the market often oscillates, sometimes sharply, but without producing a sustained directional trend.
Solana price returning to a prior range can happen for a few reasons. One common cause is a failed breakout. SOL may have pushed above a prior ceiling, attracted momentum buyers, and then lacked the follow-through needed to maintain higher prices. Once early buyers take profit and late buyers hesitate, price can slide back into the range it escaped. Another cause is a broad shift in crypto risk sentiment. When the market turns cautious, high-beta assets like SOL often retrace into familiar zones as traders reduce exposure and prefer liquidity. This is why the phrase “Solana price slips back into old range” is so important. It’s not just descriptive—it’s diagnostic. It suggests the market is in reassessment mode. Ranges are essentially negotiations, and negotiations can end in either direction depending on what side gains conviction.
Why ranges trap traders and reward patience
A range-bound environment tends to punish emotional decision-making. If you buy every green candle, you often buy near resistance and get rejected. If you short every red candle, you often short near support and get snapped back. This back-and-forth is why ranges create “chop,” and why traders often talk about being “chopped up” in sideways conditions.
The edges of the range are where the highest-quality information tends to appear. Support and resistance are not magical; they are zones where orders cluster because many participants see the same levels. That is also why those levels can produce fake-outs. Solana price may briefly dip below support, trigger stop-losses, and then rebound sharply. Or it may pop above resistance, trigger breakouts, and then roll back down. Understanding this behavior helps you avoid overreacting to single candles and instead focus on confirmation.
The market memory effect: why old levels keep mattering
Markets have memory because participants remember where they made or lost money. If Solana price previously bounced near a zone, buyers may anticipate another bounce there. If it previously rejected near a ceiling, sellers may anticipate another rejection. That collective memory can make old ranges surprisingly “sticky,” even when the news cycle changes. This also explains why Solana price can feel magnetized to a specific band. As SOL drifts within an old range, traders often place buy orders near support and sell orders near resistance, reinforcing the boundaries until a catalyst forces a decisive move.
Why $78 support comes into focus for Solana price
Within the current structure, $78 has become the level people reference as the key support zone. The reason is straightforward: it sits near the lower boundary of the old range, and the market has repeatedly treated it as a place where selling pressure slows and buyers begin to engage. When price repeatedly reacts around a level, that level becomes more important, not less. Each retest adds information, and each defense builds a narrative that the level “matters.”
Solana price approaching $78 is significant because it’s a point where the market’s next choice becomes more visible. If SOL holds, the range remains intact and a rebound toward the middle or top of the range becomes plausible. If SOL breaks, the market may interpret the breakdown as a signal that the old range is failing, potentially opening the door to lower supports.
Support is a zone, not a single number
Even though people say “$78 support,” real support often spans a band. That band may include a few dollars above and below, depending on volatility. This is why you might see Solana price dip under $78 briefly and still recover. In many cases, what matters is not the intraday wick but how price closes. A strong close back above the level can signal a bear trap. A sustained close below can signal a real breakdown. Because SOL is known for volatility, it’s especially important to treat $78 as a region rather than a precise line. The market tends to test zones with force before choosing direction.
Why $78 is psychologically powerful
Round-number levels have psychological weight. Traders like simple numbers because they’re easy to remember and easy to plan around. When Solana price hovers near $78, it becomes a focal point for stop-loss placement, limit orders, and public commentary. That concentration of attention can amplify volatility at the level. This creates a paradox. The more popular a support level becomes, the more likely it is to be tested aggressively, because liquidity tends to sit there. That’s why you often see sharp moves around “obvious” levels. They attract both genuine buyers and opportunistic traders hunting for stop runs.
Solana price technical analysis: what the charts are signaling
Technical analysis doesn’t predict the future, but it does help you identify conditions that tend to precede certain outcomes. When Solana price is range-bound and approaching a key level like $78, the most useful indicators are the ones that clarify momentum, trend bias, and volatility.
RSI and momentum: oversold pressure versus bounce potential
The RSI (Relative Strength Index) is commonly used to gauge momentum and possible oversold conditions. When RSI drops into lower ranges, it suggests recent selling has been strong. That can increase the probability of a bounce, especially when price is near support. However, oversold does not guarantee reversal. In strong downtrends, RSI can stay depressed for longer than expected while price continues to grind lower. In a range, RSI can be more helpful because ranges often oscillate between “too hot” and “too cold” conditions. If Solana price is near $78 while momentum looks stretched, a short-term rebound becomes a logical possibility. The confirmation still comes from price action, not the indicator itself.
Moving averages: dynamic resistance above Solana price
Moving averages act like dynamic trend markers. When Solana price is above key moving averages, traders often interpret that as healthier structure. When Solana price is below them, rallies can stall because sellers use those averages as areas to unload positions. In the current context, the idea that SOL is struggling to reclaim stronger trend footing is consistent with the broader impression of a market that is not yet confident enough to trend upward. If Solana price holds $78 and begins to climb, the next meaningful question becomes whether it can reclaim moving averages and keep them as support. If it fails, the market may keep treating rallies as selling opportunities within the range.
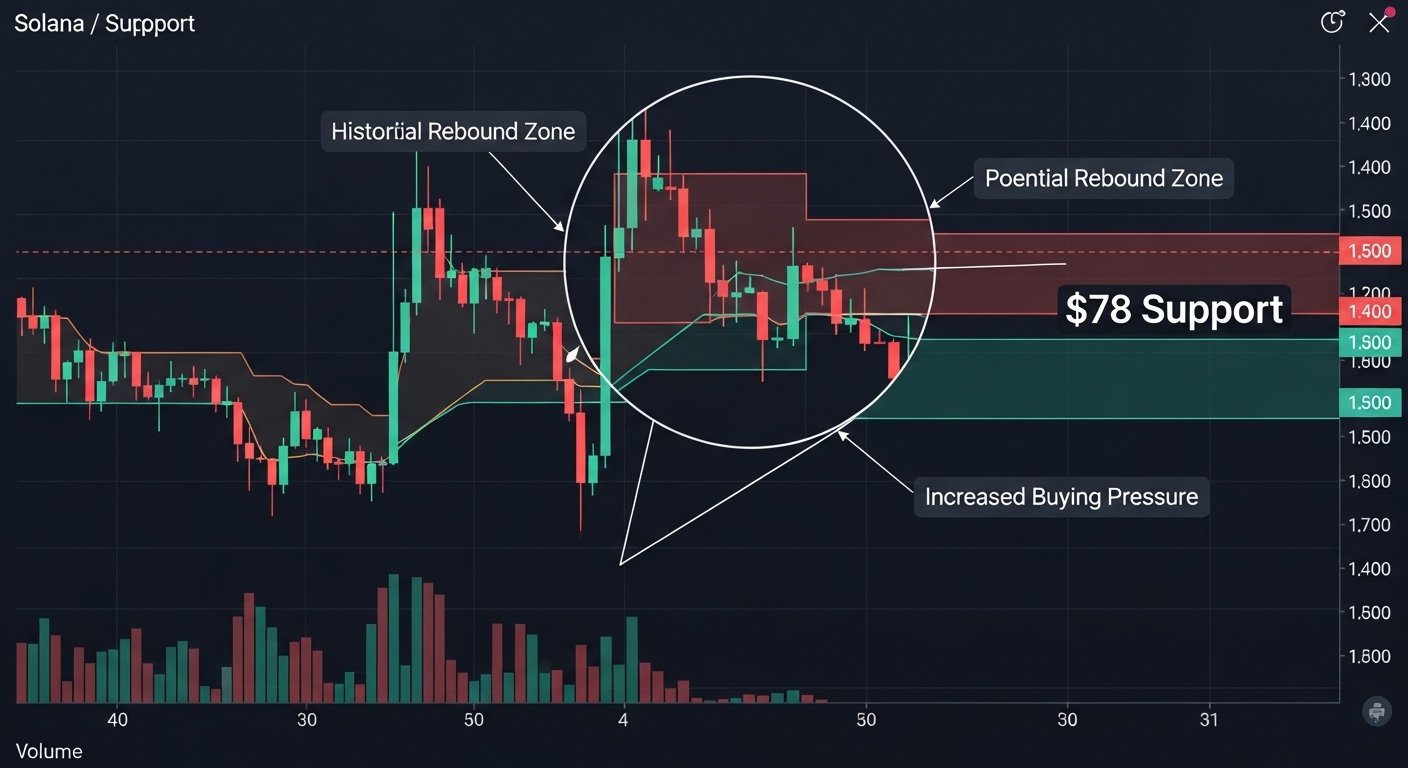
Support and resistance mapping: the old range boundaries
Within a classic range structure, the bottom boundary is support and the top boundary is resistance. As Solana price tests the lower boundary near $78, the next resistance levels to watch are typically the mid-range area (where price often pauses) and then the upper boundary (where sellers tend to defend). The major insight here is behavioral. If SOL bounces from $78 but repeatedly fails to reach the upper boundary, the range is weakening. If SOL bounces strongly and starts making higher highs within the range, buyers are gaining influence. The range itself becomes a diagnostic tool.
Why Solana price is under pressure: macro and crypto-wide catalysts
Solana price does not move in isolation. Even when the Solana ecosystem shows strong user engagement and developer activity, SOL still trades as a risk asset. That means it responds to liquidity conditions, broader crypto sentiment, and the behavior of Bitcoin and Ethereum.
Bitcoin’s gravity and risk appetite
In most market cycles, Bitcoin sets the tone. When Bitcoin is steady or rising, altcoins often benefit from improved risk appetite. When Bitcoin becomes uncertain, capital often rotates away from higher-volatility assets. Solana price, being more volatile than Bitcoin, can feel that shift quickly.
This is one reason Solana price slipping back into an old range can happen even without a Solana-specific negative event. Sometimes the market is simply de-risking broadly, and SOL returns to a familiar consolidation zone where buyers and sellers are comfortable transacting.
Liquidity, volatility, and the leverage effect
Crypto markets are heavily influenced by derivatives activity. When leverage builds, price moves can become exaggerated because liquidations force traders to buy or sell rapidly. Around key levels like $78, the market can experience sudden spikes in volatility as stop-losses trigger and positions get unwound. This leverage effect is why Solana price can appear calm for a while and then move sharply within hours. A level like $78 becomes a hotspot because many traders place risk controls around it, and that clustering can create sudden cascades.
Narrative cycles: why headlines can’t hold a trend alone
Even strong narratives don’t automatically create sustained price appreciation. The market often needs both a narrative and supportive structure. If Solana price is slipping despite positive ecosystem developments, it suggests traders may be prioritizing macro conditions or technical levels over the story. This is not necessarily bearish long term. It simply highlights that the market is currently trading structure first, narrative second. In that environment, the $78 support becomes even more important because it’s one of the clearest structural reference points.
Scenarios to watch: what happens next for Solana price
Instead of making a single prediction, it’s more useful to outline scenarios with clear signals. When Solana price is near $78 and inside an old range, the next move often depends on how price behaves at the boundary.
Bullish scenario: $78 holds and Solana price rotates upward
In a bullish scenario, Solana price tests the $78 support region, finds strong dip buying, and begins to print higher lows. The immediate goal in that situation is not “a moonshot.” It’s a return to the middle of the range and then an attempt to challenge the upper boundary. If SOL can reclaim prior resistance levels and hold above them, it signals the market is transitioning from defense to offense.
What would confirm this? You’d typically look for repeated failures to break below $78, followed by stronger closes on upswings. You might also see improving momentum indicators and more confidence in higher time frames. The key is that a bullish scenario becomes more credible when the market stops selling every bounce.
Bearish scenario: a decisive breakdown below $78
In a bearish scenario, Solana price breaks below $78 and fails to reclaim it quickly. The failure to reclaim is crucial because that is what often turns former support into new resistance. When that happens, traders who bought the support may become sellers on the retest, and short sellers may feel more confident.
If the breakdown is real, Solana price could seek the next demand zone lower. Where exactly that is depends on historical price action and market conditions, but the broader point is structural: a clean loss of the range floor often leads to a new leg down or, at minimum, a deeper consolidation below the old range.
Neutral scenario: continued range-bound chop
The neutral scenario is the one most people underestimate: Solana price could continue chopping between support and resistance for longer than expected. In that case, $78 remains defended but rallies remain capped, creating a sideways grind that frustrates both bulls and bears. This scenario often ends when a catalyst shifts sentiment or liquidity conditions change. Until then, the range persists, and the market continues to “trade the box.” For many participants, the best move in this environment is patience, smaller position sizes, and a focus on clear confirmation.
What long-term holders should consider when Solana price is testing support
Long-term holders often view support tests differently than short-term traders. Instead of looking for a quick trade, they evaluate whether the asset’s broader thesis remains intact and whether the price level offers a favorable long-term entry relative to risk. Solana continues to be associated with high-throughput infrastructure, strong developer interest, and an ecosystem that spans DeFi, NFTs, and consumer applications. Those fundamentals can create long-term demand for SOL, but they do not prevent pullbacks. In fact, even the strongest networks experience periods where price resets, leverage clears, and the market rebuilds a base.
When Solana price slips back into an old range, long-term holders often look for signs of stabilization: slower selling pressure, stronger rebounds from support, and a gradual improvement in structure. If $78 holds and SOL begins to build higher lows over time, it can be interpreted as the market re-accumulating within the range. If $78 breaks and the market trends lower, long-term holders may simply adjust expectations and look for the next major base formation.
Risk management perspective: why $78 is both an opportunity and a danger
It’s tempting to treat $78 support as an easy “buy zone,” but visible levels carry unique risks. Because so many traders are watching the same number, price action around it can be chaotic. The market may briefly break below $78 to flush stops and then recover, or it may bounce just enough to lure buyers before breaking again.
A healthier way to think about it is to focus on confirmation and invalidation. Confirmation means you look for evidence that Solana price is holding the region, such as repeated defenses and stronger closes. Invalidation means you define what would prove the idea wrong, such as sustained trading below support or repeated failed reclaim attempts. This mindset reduces the chance of getting emotionally pulled into every short-term fluctuation.
No matter your time horizon, the main takeaway is simple: the closer Solana price gets to a major level like $78, the more disciplined you need to be. That discipline is what separates a structured plan from reactive trading.
Conclusion
Solana price slipping back into its old range is a meaningful structural event, not just a temporary dip. It suggests the market is back in negotiation mode, and the most important reference point in that negotiation is the $78 support region. If Solana price holds $78 and begins rotating higher, the range may remain intact and set the stage for a stronger recovery attempt. If Solana price breaks $78 decisively and fails to reclaim it, the market may interpret the move as a breakdown, potentially inviting lower support tests and a shift toward a more bearish short-term structure. The next chapter for SOL will likely be written at the edges of this range, not in the middle. Watch how Solana price behaves around $78, pay attention to follow-through, and remember that in range-bound markets, patience often outperforms urgency.
FAQs
Q: Why is Solana price focusing on $78 support right now?
Solana price is focusing on $78 because it sits near the lower boundary of the current old range, making it a key support and resistance reference point where buyers and sellers repeatedly react.
Q: What does it mean that Solana price is back in an old range?
It means Solana price is trading within a prior consolidation zone instead of trending. This often signals uncertainty and creates a range-bound market where support and resistance levels become especially important.
Q: If Solana price breaks $78, does that confirm a crash?
Not necessarily, but it can confirm a short-term structural shift. A sustained break and failure to reclaim $78 often suggests a breakdown and can increase the probability of testing lower support zones.
Q: Can Solana price bounce even if momentum indicators look weak?
Yes. Indicators like RSI can show oversold conditions that increase bounce potential, especially near support. Still, confirmation should come from price action, such as strong closes and successful defenses.
Q: What would signal a healthier recovery in Solana price?
A healthier recovery often involves Solana price holding support, reclaiming key resistance levels inside the range, and eventually turning prior resistance into support, supported by improving momentum and stronger trend structure.
Also Read: Best Crypto to Buy Now XRP, Solana, Cardano