
Bitcoin Price Crash Target Elliott Wave Forecast
An Elliott Wave analyst warns a final Bitcoin price crash may be next. See the target zone, key levels, catalysts, and signals traders monitor.

Bitcoin has a way of turning confident predictions into cautionary tales. When price trends upward for weeks, the market slowly begins to feel “safe” again. Leverage builds, social feeds fill with victory laps, and even skeptical investors start to wonder if they missed the real move. Then, without warning, Bitcoin can rip lower, breaking a level everyone thought would hold. That’s why the idea of a looming Bitcoin price crash—especially one described as a “final move”—captures attention. It’s not just fear; it’s the recognition that Bitcoin’s biggest drops often happen when the crowd is least prepared for them.
The current conversation is shaped by one recurring technical framework: Elliott Wave analysis. An Elliott Wave analyst isn’t necessarily saying Bitcoin is doomed forever. The claim is more specific and more tactical: the market may be completing a larger corrective pattern, and the last leg could be a sharp downturn that shakes out late bulls, overleveraged traders, and weak hands. In that story, a Bitcoin price crash becomes the final chapter of a correction rather than the beginning of a permanent collapse.
Still, the headline question remains: if the crash is the final move, what’s the target? Elliott Wave forecasting doesn’t usually land on one exact number. It tends to define a zone where multiple factors line up: prior support, Fibonacci retracement levels, liquidity pockets, and psychological round numbers. The “target” is often the region where the market’s selling pressure is expected to exhaust and where a durable base can form.
In this article, we’ll unpack what an Elliott Wave analyst means by a final move down, why a Bitcoin price crash can unfold quickly, and how traders estimate a target zone without getting trapped by a single forecast. You’ll also learn how to judge confirmation signals, invalidation levels, and the difference between a routine pullback and a deeper drawdown. By the end, you’ll have a clear framework for understanding the crash narrative in a practical, level-by-level way.
Elliott Wave: Why Analysts See a Final Crash Leg
Elliott Wave theory is built on a simple but powerful premise: markets move in recognizable patterns because crowds behave in recognizable ways. When participants feel confident, price tends to climb in strong, impulsive waves. When confidence breaks, price shifts into corrective structures that can include sharp drops, choppy rebounds, and false recoveries. Elliott Wave analysts attempt to label those movements to identify where the market might be within the bigger cycle.
When an Elliott Wave analyst warns about a final downside move, they’re often describing the closing phase of a corrective pattern. In classic Elliott terms, that could resemble an ABC correction where the last leg—often called wave C—finishes the decline. In more complex corrections, it might be the last segment of a multi-step pattern that still ends with one more flush. Either way, the idea is that the structure hasn’t completed yet, and the market may still need one decisive selloff to reset positioning.
A Bitcoin price crash can fit naturally into this narrative because Bitcoin is an asset where crowd psychology is amplified. The same emotions that push price up quickly—fear of missing out, momentum chasing, leverage—can flip into panic, forced selling, and liquidation cascades when price breaks key levels.
Why a Bitcoin Price Crash Can Be the “Final Move” Rather Than the Start of Something Worse
The phrase “final move” matters because it implies an ending, not an endless decline. Many Elliott Wave analysts believe that corrections have a rhythm: they punish complacency, shake out leverage, and eventually reach a point where selling becomes exhausted. When sellers are spent and buyers become willing again, price can begin building a base that supports a new trend.
This does not mean the market instantly rebounds to new highs. It means the most intense phase of downside pressure may conclude within a defined target zone. A Bitcoin price crash in this context is less about total destruction and more about completing a pattern that clears the deck. In practical terms, traders look for a climax where downside momentum peaks, liquidity runs thin, and price briefly overshoots support before stabilizing.
The most important detail is that Elliott Wave analysis is probabilistic. The “final move” thesis is a scenario with conditions, not a certainty. The market can always invalidate a bearish count by reclaiming critical levels and forming an impulsive structure upward.
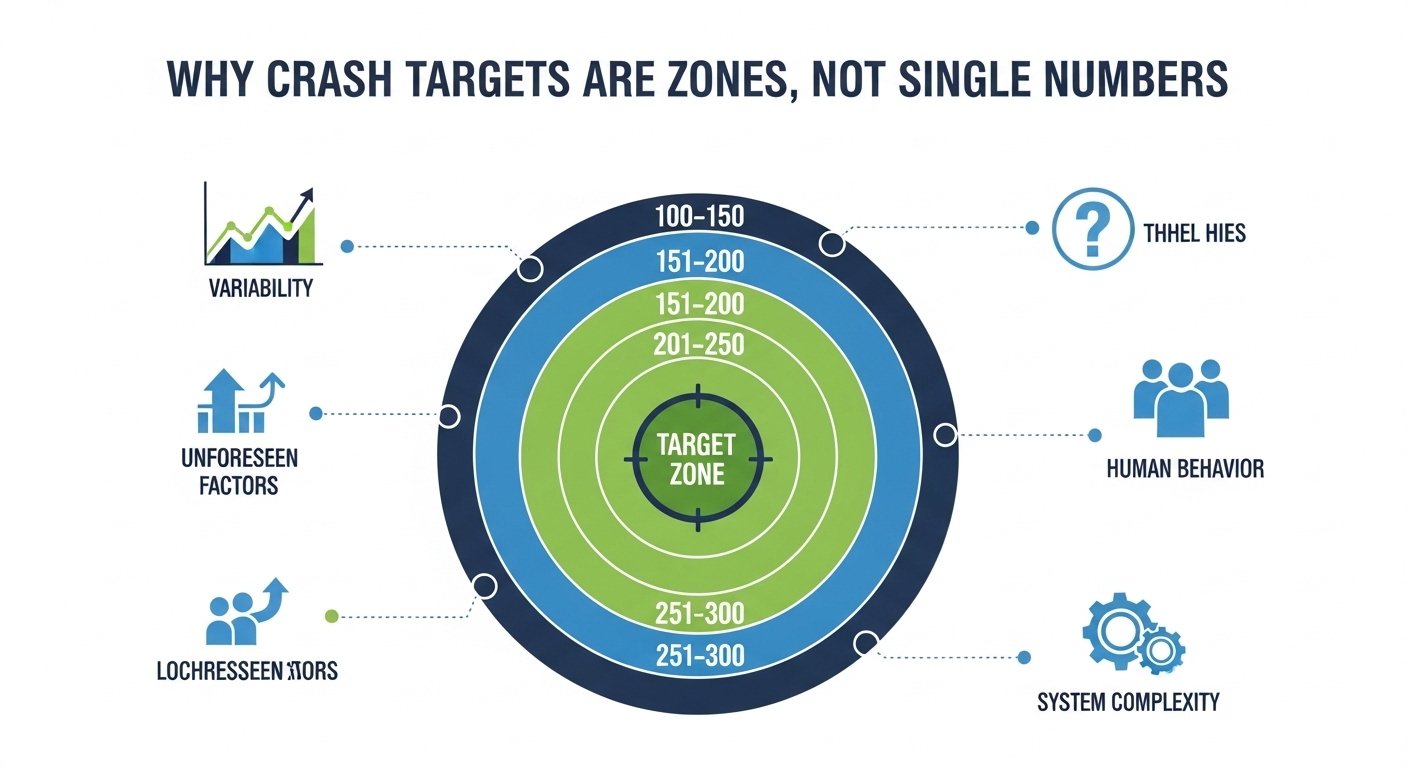
The Target Question: Why Crash Targets Are Zones, Not Single Numbers
A common misunderstanding is that technical analysts can point to one exact number and call it a target. In reality, a Bitcoin price crash target is usually a region that represents potential demand, not a magical floor that price must touch to the dollar. Bitcoin can spike below a level during a liquidation sweep and then close the day above it. It can also hover slightly above a target zone and reverse without ever tagging the “perfect” number.
This is why experienced analysts talk about targets as areas of confluence. A target zone might include a Fibonacci retracement, a prior consolidation range, a high-volume node from previous trading, and a psychologically important round number. When these line up, the probability of stabilization increases, but nothing is guaranteed.
In the current discussion, most crash-target narratives tend to cluster into three broad categories: a moderate deep-correction zone that implies a painful but normal reset, an intermediate zone that aligns with near-term support and the “one more flush” idea, and a severe capitulation zone that would require a broader risk-off regime. Which zone matters most depends on how the market behaves at each support level.
How Elliott Wave Analysts Derive a Bitcoin Price Crash Target
Wave Structure: Identifying Where the Market Is in the Pattern
The first step is mapping. Elliott Wave analysts label key swing highs and lows to determine whether price is in an impulsive trend or a corrective phase. Corrections often show overlapping movement where rallies do not look clean and powerful, and where momentum fades quickly. If the analyst believes the prior uptrend is complete, they look for a corrective structure that has not fully resolved.
If the market appears to be in the last leg of a correction, the analyst expects a final push lower that completes the structure. That final push can become a Bitcoin price crash if it coincides with leverage and fragile sentiment, because the market can move faster than participants can adjust.
Fibonacci Levels: Measuring Where Sellers May Exhaust
A second step is using Fibonacci retracement and extension tools. Analysts often measure the prior bullish move and calculate common retracement levels. Deep corrections frequently revisit key ratios, especially when those ratios overlap with historical support. Fibonacci tools do not “cause” price to bounce; they help identify areas where many participants are watching and where order flow can concentrate.
A Bitcoin price crash target zone often emerges where a Fibonacci retracement lines up with a prior breakout region. If price rose rapidly through a level with minimal trading, the market may return to that area to “retest” it, especially after sentiment shifts from bullish certainty to defensive caution.
Market Profile and Liquidity: Where Price Can Fall Quickly
Bitcoin often moves through thin liquidity pockets. When price falls into an area with limited bids, it can drop sharply until it hits a region where buyers historically stepped in. This is why a Bitcoin price crash can feel sudden. It is not always gradual; it can be a rapid search for liquidity. Elliott Wave analysts may incorporate this by expecting sharp wave-like declines that puncture support and then reverse. The last leg down can become a liquidity sweep, grabbing stops and liquidating longs before the market stabilizes.
Invalidation Levels: The Line That Separates Thesis From Guessing
A responsible Elliott Wave forecast includes invalidations. If price breaks above a level that the bearish count says should not be broken, the count is likely wrong. This matters because it prevents “analysis” from turning into stubbornness. In a Bitcoin price crash scenario, invalidation levels often sit above the most recent major swing high or above a key resistance zone that would imply the market is back in an impulsive uptrend.
What Actually Turns a Pullback Into a Bitcoin Price Crash
Leverage and Liquidation Cascades
Bitcoin’s derivatives markets amplify moves. When traders use high leverage, a modest decline can trigger margin calls and liquidations. Liquidations sell into the market, pushing price lower, which triggers more liquidations. This feedback loop can transform a routine dip into a Bitcoin price crash.
The danger is greatest when the market is crowded in one direction. If too many participants are long and price drops into a liquidation zone, the decline can accelerate rapidly. This is why the final leg of a correction can be especially violent: it often arrives when participants assume the bottom is already in.
Funding, Positioning, and Sentiment Shifts
When funding rates are elevated, it can signal aggressive long positioning. If price begins to fall, those positions become vulnerable. A Bitcoin price crash is more likely when optimistic sentiment is high but structural support is weak. In these conditions, price can break a key level and flip the narrative from “buy the dip” to “protect capital.”
Correlation With Broader Risk Markets
Bitcoin sometimes trades like a high-volatility tech proxy, especially during risk-off regimes. If macro conditions tighten, liquidity drains from speculative assets first. A larger risk-off move can intensify a Bitcoin price crash, especially if it coincides with technical weakness and overleveraged positioning. This doesn’t mean Bitcoin is always tied to stocks. It means the crash risk increases when multiple pressures align: technical breakdown, crowded positioning, and a broader shift in risk appetite.
Where Could the Target Be? Mapping Practical Crash Zones
A clear way to think about a Bitcoin price crash target is to view it as a staircase of potential supports. Each step is a zone where buyers might defend, and each break increases the probability of reaching the next zone. The “final move” target is the step where the market is most likely to exhaust selling and stabilize.
Near-Term “One More Flush” Zone
In some wave counts, analysts expect a final move that is sharp but not catastrophic. This scenario assumes the market dips below a recent support area, triggers liquidations, and then quickly finds demand. The target zone here is typically near recent consolidation regions and prior breakout points on higher timeframes. In this framework, the Bitcoin price crash is more like a controlled demolition: dramatic on the lower timeframes, but still within a range that can be defended if long-term holders remain confident.
Deep Correction Zone That Resets the Market
A deeper correction target zone is where the market revisits a more significant weekly support region. This type of move would likely feel like a true Bitcoin price crash to most participants because it would break levels that people treated as “must hold.” It often coincides with broader capitulation, negative headlines, and a widespread belief that the bull run is over. From an Elliott Wave perspective, this is consistent with a final C-wave style decline that completes a larger correction. The target is usually a confluence of major retracement levels and historical support.
The Severe Capitulation Zone
The most extreme crash targets typically require a different macro environment. These scenarios assume a strong risk-off regime with continued liquidity tightening, widespread deleveraging, and a multi-asset drawdown. In that case, a Bitcoin price crash could reach a zone that feels shocking compared to recent price action, revisiting older structural levels that many participants haven’t considered in months. This scenario is not the default outcome. It is a tail risk. But it remains part of the conversation because Bitcoin has historically experienced large drawdowns even within long-term adoption trends.
Confirmation Signals That a Bitcoin Price Crash Is Unfolding
A Bitcoin price crash thesis becomes stronger when multiple signals align. One major sign is a clean break of a key weekly support level followed by a failed retest. Another sign is a rapid increase in downside volatility where price moves through levels without meaningful bounces. A third sign is heavy liquidation activity, where forced selling dominates and rebounds become shallow.
Momentum indicators can also help. When downside momentum accelerates and rallies fail to recover key moving averages, it suggests the market is still in a corrective phase rather than transitioning into a new impulse uptrend. On-chain behavior can add context as well. If long-term holders remain relatively stable while short-term holders capitulate, it supports the idea that the Bitcoin price crash is a shakeout rather than a permanent breakdown. If long-term holders begin distributing aggressively, the bearish case strengthens.
Invalidation Signals: What Would Cancel the Crash Thesis
Even if a Bitcoin price crash scenario looks compelling, markets can invalidate it quickly. A major invalidation is reclaiming a broken level and holding it on higher timeframes. Another is forming a clear impulsive advance: strong rallies that do not overlap, higher highs that hold, and pullbacks that remain shallow. In Elliott Wave terms, invalidation can occur if the market does something a bearish count says it shouldn’t. That’s why it’s dangerous to cling to a crash forecast after price structure changes. The goal is not to be right emotionally; the goal is to respond to what the market is doing.
Why Traders Still Respect Elliott Wave Forecasts in Bitcoin

Bitcoin is a market where narrative shifts happen fast. Elliott Wave analysis offers a structured way to interpret those shifts without relying only on headlines. It gives traders a map of likely paths, including a Bitcoin price crash path, and it encourages scenario-based planning. The key strength of Elliott Wave is that it forces you to consider where you are in the bigger pattern. The weakness is that wave labeling is subjective. Two analysts can label the same chart differently and both can sound convincing. This is why the best use of wave analysis is as a framework combined with confirmation signals, not as a standalone prophecy.
Managing Risk During a Bitcoin Price Crash Narrative
A crash narrative can be useful even if it never fully plays out. It encourages caution during leverage-heavy phases and pushes investors to think about downside levels before panic arrives. The point is not to predict the exact low of a Bitcoin price crash. The point is to have a plan for what you will do if key supports break.
Risk management also means acknowledging that Bitcoin can overshoot. If a target zone is widely watched, price can briefly dip below it and then reverse. That’s why many traders treat the target as a range and watch how price behaves inside it. Stabilization, reclaiming levels, and improving momentum are more important than a perfect touch.
Conclusion
The idea that an Elliott Wave analyst predicts Bitcoin will crash in a final move is ultimately a claim about structure and psychology. In this view, the market may be finishing a corrective pattern, and the last leg could be the sharpest—driven by liquidations, thin liquidity, and a sudden collapse in confidence. The “target” is best understood as a zone where multiple forms of support converge, not a single precise number.
If the Bitcoin price crash scenario unfolds, traders will watch how price reacts at each major support step, looking for confirmation that selling is exhausting and that a base is forming. If the market invalidates the bearish structure by reclaiming key levels and rebuilding an impulsive uptrend, the crash thesis weakens or disappears. Either way, understanding the logic behind the forecast helps you think in scenarios instead of emotions. Bitcoin will keep doing what it always does: rewarding preparation and punishing certainty. Whether the next big move is a Bitcoin price crash or a surprise rebound, the investors who plan around levels, structure, and risk will be the ones still standing when the volatility clears.
FAQs
Q: What does “final move” mean in Elliott Wave analysis?
In Elliott Wave terms, “final move” typically refers to the last leg of a corrective structure, such as the last decline in an ABC pattern or the ending segment of a complex correction. In a Bitcoin price crash narrative, it implies a capitulation-like drop that completes the correction.
Q: Is a Bitcoin price crash target a single number?
Usually not. A Bitcoin price crash target is typically a zone where support levels, historical trading activity, and Fibonacci retracement areas overlap. Price can briefly overshoot the zone and still reverse, so behavior matters more than precision.
Q: Why can Bitcoin crash so fast?
Bitcoin can fall quickly due to leverage and liquidation cascades. When price breaks key levels, forced selling accelerates the decline, turning a pullback into a Bitcoin price crash in a short time.
Q: How can I tell the difference between a normal correction and a crash?
A normal correction often shows stabilization, higher-timeframe support holding, and constructive consolidation. A Bitcoin price crash tends to break levels rapidly, produce weak bounces, and show heightened volatility and liquidation-driven selling.
Q: What would invalidate a Bitcoin price crash forecast?
A crash forecast weakens if price reclaims key resistance, holds above it on higher timeframes, and forms a clear impulsive uptrend. In other words, the market structure must support the bearish idea; if structure changes, the Bitcoin price crash thesis may be wrong.
Also Read: Crypto ETFs Turn Volatile in Feb as Bitcoin Lags, XRP Shines