Bitcoin Market Bottom Nearing Against Gold?
Bitcoin market bottom may be nearing against gold, says analyst. Explore BTC-to-gold ratio, price trends, and what it means for investors.
Cryptocurrency market has always been defined by cycles—periods of explosive growth followed by sharp corrections that test even the most resilient investors. As Bitcoin navigates another phase of volatility, many traders and long-term holders are asking the same question: Has the Bitcoin market bottom finally arrived? According to a growing number of analysts, the answer may lie not in the U.S. dollar price of Bitcoin alone, but in its performance relative to gold.
When measured against the precious metal, which has long been considered a safe-haven asset, signals suggest that the Bitcoin market bottom may be nearing, at least if measured against gold, analyst says. This perspective shifts the focus from short-term price fluctuations to a broader macro comparison—Bitcoin versus gold. By examining the BTC-to-gold ratio, historical patterns, and market sentiment, analysts are uncovering clues that may indicate a turning point in the current cycle. In this article, we explore what this means, why it matters, and how investors can interpret these signals in today’s evolving financial landscape.
Bitcoin-to-Gold Ratio
The concept of comparing Bitcoin to gold might seem unconventional to some investors. After all, Bitcoin is a digital asset barely over a decade old, while gold has served as a store of value for thousands of years. However, the Bitcoin-to-gold ratio has become a powerful analytical tool.
What Is the BTC-to-Gold Ratio?
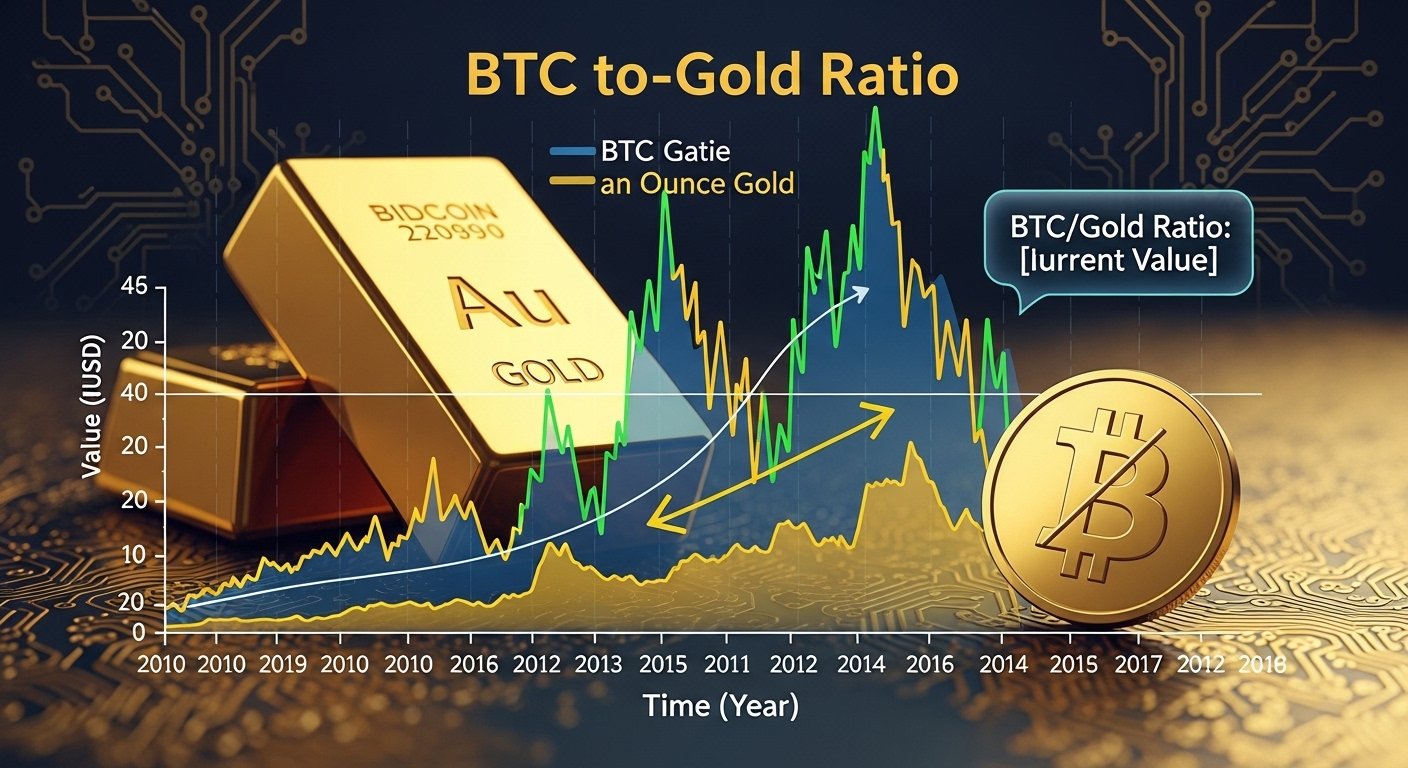
The BTC-to-gold ratio measures how many ounces of gold one Bitcoin can buy. Rather than evaluating Bitcoin in U.S. dollars, this ratio compares two assets often seen as inflation hedges and alternative stores of value. When the ratio rises, Bitcoin is outperforming gold. When it falls, gold is outperforming Bitcoin. Historically, sharp declines in this ratio have coincided with bearish sentiment in crypto markets—often close to what later turns out to be the Bitcoin market bottom.
Why Analysts Watch This Metric
Analysts who suggest that the Bitcoin market bottom may be nearing argue that comparing Bitcoin to gold removes distortions caused by fiat currency fluctuations. Since both assets respond to macroeconomic forces like inflation, interest rates, and monetary policy, the ratio can reveal relative strength or weakness. Gold often performs well during periods of uncertainty and tightening liquidity. Bitcoin, on the other hand, tends to struggle when risk appetite declines. When Bitcoin significantly underperforms gold, it can signal capitulation—a key characteristic of market bottoms.
Historical Patterns: Bitcoin vs Gold at Previous Bottoms
History doesn’t repeat itself perfectly, but it often rhymes. Looking back at previous bear markets provides important context for understanding whether the Bitcoin market bottom may be nearing.
The 2014–2015 Bear Market
After the 2013 bull run, Bitcoin fell nearly 85% from its peak. During this time, gold held relatively steady. The BTC-to-gold ratio collapsed, reflecting extreme weakness in Bitcoin relative to the traditional safe-haven asset. When the ratio stabilized and began to recover, it coincided with the formation of a long-term Bitcoin market bottom. Investors who recognized the shift in relative strength were positioned early for the next bull cycle.
The 2018 Crypto Winter
Following the 2017 all-time highs, Bitcoin once again experienced a brutal downturn. The BTC-to-gold ratio dropped sharply, signaling sustained underperformance. Analysts noted that once the ratio stopped falling and showed signs of accumulation, the Bitcoin market bottom was likely forming. Months later, Bitcoin began a gradual recovery that eventually led to new highs in 2021.
The 2022–2023 Correction
In the most recent downturn, tightening monetary policy and global economic uncertainty pressured risk assets. Gold regained appeal as central banks raised interest rates. Bitcoin struggled in comparison, and the BTC-to-gold ratio again declined significantly. Now, analysts observing stabilization in this ratio suggest that the Bitcoin market bottom may be nearing, at least if measured against gold, analyst says. The similarity to previous cycles is drawing attention from institutional and retail investors alike.
Macro Factors Driving the Bitcoin and Gold Relationship
To understand why the Bitcoin market bottom may be nearing, it’s crucial to explore the macroeconomic backdrop influencing both assets.
Inflation and Monetary Policy
Bitcoin is often described as “digital gold” due to its limited supply and decentralized nature. However, during periods of aggressive interest rate hikes, liquidity drains from markets. This environment tends to benefit gold more than Bitcoin. Gold’s long-established reputation as a hedge against inflation gives it stability during uncertainty. Bitcoin, being more volatile, reacts more dramatically to liquidity shifts. When monetary tightening slows or reverses, Bitcoin historically regains strength. If analysts are correct, the stabilization of the BTC-to-gold ratio may indicate that the worst of liquidity tightening is behind us—potentially signaling that the Bitcoin market bottom is forming.
Risk Appetite and Market Psychology
Bitcoin is still viewed as a risk-on asset by many institutional investors. When fear dominates financial markets, capital flows toward traditional safe havens like gold. As sentiment improves and risk appetite returns, Bitcoin often outperforms gold significantly. Therefore, extreme underperformance relative to gold can represent peak fear—an environment often associated with market bottoms.
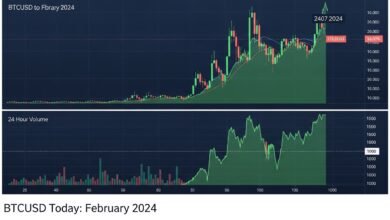
Technical Analysis: Signs of a Forming Bottom
Beyond macro analysis, technical indicators support the theory that the Bitcoin market bottom may be nearing.
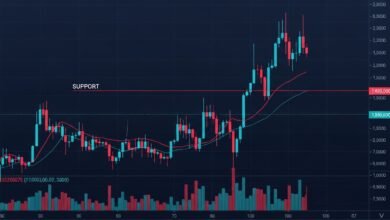
Long-Term Support Levels
Bitcoin has historically respected long-term moving averages, such as the 200-week moving average. In past cycles, price consolidation around these levels marked accumulation phases. When combined with stabilization in the BTC-to-gold ratio, these technical signals strengthen the argument that the market may be approaching a turning point.
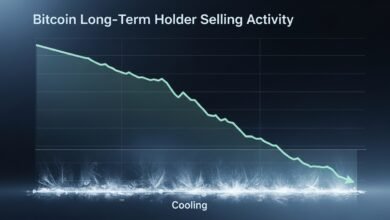
On-Chain Metrics
On-chain data shows increasing long-term holder accumulation during downturns. Metrics such as realized price and dormancy flows suggest that strong hands are quietly accumulating Bitcoin at discounted levels. This behavior has historically occurred near the Bitcoin market bottom, further reinforcing analyst optimism.
Institutional Perspectives on Bitcoin and Gold
Institutional investors increasingly analyze Bitcoin alongside traditional assets like gold. Portfolio diversification strategies often treat Bitcoin as a high-beta alternative to gold. When Bitcoin underperforms gold significantly, some institutions view it as undervalued relative to its historical risk premium. If analysts are correct that the Bitcoin market bottom may be nearing, institutional accumulation could accelerate. Gold-backed exchange-traded funds (ETFs) and spot Bitcoin ETFs now coexist in global markets, making capital rotation between these assets easier than ever. This dynamic strengthens the relevance of the BTC-to-gold comparison.
Risks to the Bottom Thesis
While the idea that the Bitcoin market bottom may be nearing, at least if measured against gold, analyst says is compelling, it is not without risks. Macroeconomic uncertainty remains elevated. If central banks continue aggressive tightening or if global economic conditions worsen, both Bitcoin and gold could face volatility. Additionally, regulatory developments in major economies could impact crypto market sentiment. While historical patterns provide guidance, no indicator guarantees that a definitive Bitcoin market bottom has been reached. Investors should approach bottom-calling cautiously and consider risk management strategies.
What This Means for Investors
For long-term investors, the potential that the Bitcoin market bottom may be nearing presents both opportunity and responsibility. Accumulation strategies such as dollar-cost averaging can help mitigate timing risk. Monitoring the BTC-to-gold ratio offers a broader macro lens beyond daily price swings. If history serves as a guide, periods of extreme pessimism relative to gold have preceded substantial upside in Bitcoin. However, patience is essential. Market bottoms often form gradually, with extended consolidation before a breakout occurs.
Bigger Picture: Bitcoin as Digital Gold
The ongoing comparison between Bitcoin and gold highlights an evolving narrative. Bitcoin’s fixed supply and decentralized architecture have strengthened its position as a digital store of value. While gold remains a cornerstone of traditional finance, Bitcoin continues to mature as an asset class. The interplay between these two assets provides valuable insights into broader economic trends. If analysts are correct that the Bitcoin market bottom may be nearing, it could mark another chapter in Bitcoin’s long-term adoption story—one where it increasingly competes with gold for safe-haven status.
Conclusion
The idea that the Bitcoin market bottom may be nearing, at least if measured against gold, analyst says offers a compelling framework for evaluating the current market cycle. By analyzing the BTC-to-gold ratio, historical patterns, macroeconomic factors, and technical indicators, analysts are identifying signs of potential stabilization. While no single metric can perfectly predict a market bottom, the convergence of relative underperformance, macro shifts, and on-chain accumulation suggests that Bitcoin may be approaching a pivotal moment. Investors should remain cautious but informed. Whether the absolute bottom has arrived or not, history shows that periods of extreme pessimism often create the foundation for future growth. As Bitcoin continues to evolve alongside gold, the relationship between these two assets will remain a critical lens for understanding market cycles.